You know what you’re doing for supper this evening, right? Your plans for the next few days, however, may be more vague—you’ve stuff in the fridge to work with but no set menus—and probably only the faintest notion of what you might be cooking next week. Weather forecasts can be much the same. Predictions for the next few hours or days can be surprisingly accurate, but the further ahead you look, the less reliable they become.
Among the products and services it updated for the 2017 hurricane season, the National Hurricane Center (NHC) included a smaller cone of uncertainty. What does that mean?
When meteorological agencies issue tropical cyclone forecasts, the potential path of the system is indicated on maps by a line either side of which there is an ever-widening area indicating the growing uncertainty as to its track. This is the cone of uncertainty, and it graphically indicates the historical margin of error in the meteorologist’s forecast track for the center of the tropical cyclone. While they may vary in coloration or format, many weather forecasting agencies use a cone of uncertainty to project a storm's path; to keep things simple, we’ll stick to discussing the NHC cone for this blog.
The cone is formed around circles centered on points that indicate the most likely location of the center of the storm system at 12-hour forecast intervals. It is important to note, as the NHC does at the top of every track map it issues, that the cone does not indicate the strength of the storm system and also that hazardous conditions can be experienced well outside it. The track map in Figure 1, for example, shows a tropical storm warning in force in North Carolina, largely outside the cone depicted. Furthermore, the cone does not indicate related hazards such as potential storm surge or rainfall. A significant enhancement this year, however, is that NHC maps now include the current extent of hurricane- and tropical storm-force winds.
NHC forecasts cover a five-day period; their track maps show the forecast for the first three days as a white cone and the even more uncertain forecast for the next two days as a less conspicuous stippled extension of it. The dots along the center line of the cone represent the most probable track of the storm, so the line they describe can change with each forecast as the storm progresses. The track map shown in Figure 1 was issued on October 7, 2016, when Hurricane Matthew was expected to continue turning south toward the Bahamas after it passed North Carolina; it actually continued eastward into the Atlantic toward Bermuda—a transition reflected in subsequent track maps for the storm.
The width of the cone at each dot, however, stays the same for every forecast throughout the season; it has nothing to do with the width or strength of the system. The diameter of each circle forming the cone represents two thirds of the error in forecasts for the previous five years; in other words, the circles are drawn to indicate a 60 to70% likelihood that the track will remain within the cone. Every year the NHC reviews the error in forecasts for the previous five years and updates the radii of the circles accordingly (Table 1).
| Forecast Period (hours) | Circle Radius Atlantic Basin (nautical miles) | Circle Radius Eastern North Pacific Basin (nautical miles) |
|---|---|---|
| 3 | 16 | 16 |
| 12 | 29 | 25 |
| 24 | 45 | 40 |
| 36 | 63 | 51 |
| 48 | 78 | 66 |
| 72 | 107 | 93 |
| 96 | 159 | 116 |
| 120 | 211 | 151 |
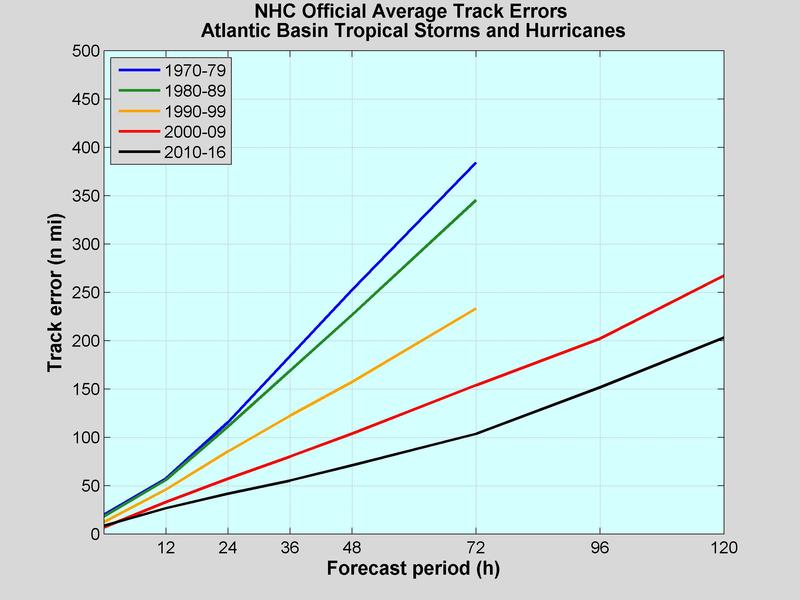
As weather forecasts continue to get better, the average track error shrinks (Figure 2), and the cone gets a little smaller every year. The NHC’s announcement of a smaller cone for 2017 therefore simply marks a routine annual adjustment. But if forecast accuracy continues to improve over time, as we all hope it will, the cone of uncertainty will diminish even more in future years. The question is, just how small can it get?
Real-Time Catastrophe Loss Estimates—What Do They Really Mean?