My previous blog on loss adjustment expenses (LAE) was written just as Hurricane Maria was developing, before anyone could have anticipated its enormous impact on Puerto Rico. Because of the economic circumstances on the island prior to the hurricane and devastation afterward, I wanted to take a closer look to understand what lies ahead for the people of Puerto Rico.
Last time I described using metrics such as claims per adjuster as an indicator of an event’s impact on LAE. It has been widely reported that only about half of the dwellings are insured in Puerto Rico, so some reasonable assumptions can help us understand where claims are likely to come from. The Wall Street Journal recently reported that there are slightly more than 500,000 active mortgages on the island. We can assume that virtually all mortgaged properties have insurance, so this number provides a reasonable proxy for the insured properties.
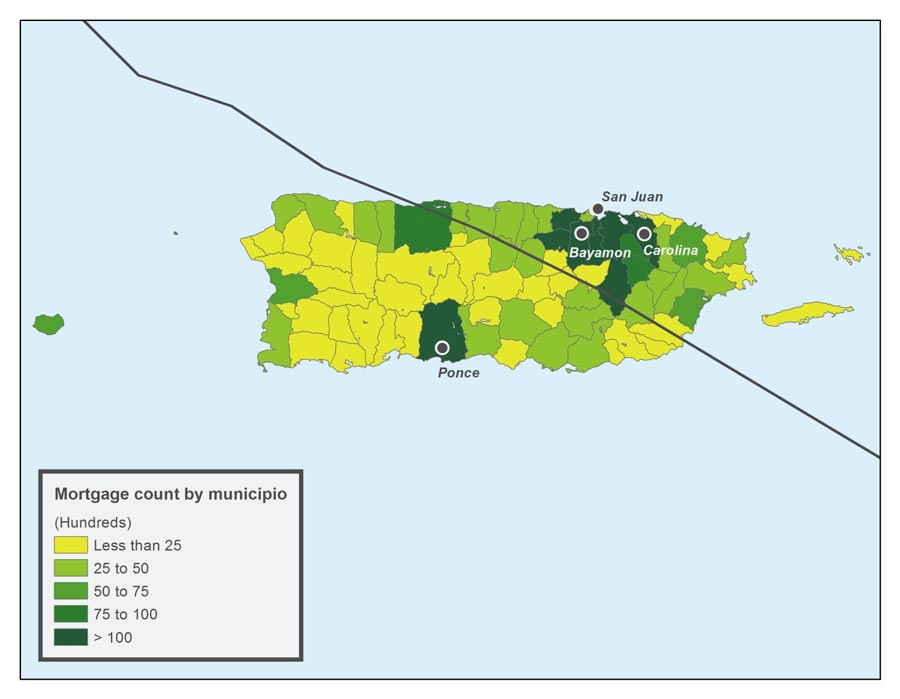
Using information from the U.S. Census and the annual Puerto Rico Community Survey (PRCS), we can begin to understand how these mortgages are spatially distributed by municipio, or municipality. According to the most recent PRCS survey results, about 20% of the total dwellings are vacant. Of the remaining dwellings, about two thirds are owner occupied. The PRCS only collects mortgage data on owner-occupied dwellings, but this accounts for 70% of the reported active mortgages. The count of mortgages (in hundreds) is plotted in Figure 1, along with the four largest population centers. To give this map context the National Hurricane Center storm track for Hurricane Maria has been overlaid. Most of the mortgages are in the San Juan area, which was subjected to the highest wind speeds on the right of the hurricane path and is where most claims are likely to come from.
We can get the number of loss adjusters from the Quarterly Census of Employment and Wages (QCEW) as we did before. Figure 2 shows the growth and decline in loss adjuster employment on the island since 2002. The data was smoothed using a five quarter centered moving average to show the pattern. Starting in 2005, the number of loss adjusters on the island has declined by 20%, while the population has declined only about 10%.
With this data we can start looking at some possible scenarios that point to a claims adjustment period that could be longer than expected. We have come to expect claims to be settled quickly and rebuilding to begin as soon as possible. In Table 1, two possible scenarios are presented that show some of the challenges ahead. The first example assumes that every insurance-covered mortgage is a claim. This is not unreasonable given the strength and size of the hurricane as it passed over the island.
The second example assumes that only 200,000 claims are filed. This smaller number was chosen because this volume of claims was seen previously in Puerto Rico following smaller events. Last year there were about 375 claims adjusters on Puerto Rico, so we will use that number for the calculation. The third column assumes a workload of four claims per day (20 per week, 240 per quarter). The “Adjusters Needed” column shows the number of adjusters required to complete the work within a reasonable time, which is assumed to be one quarter. The last column shows the estimated number of months required to complete the task if no additional adjusters are brought to the island.
| Claims | Adjuster Employees | Claims per Week | Claims per Quarter | Adjusters Needed | Months to Complete Without Additional Help |
|---|---|---|---|---|---|
| 500,000 | 375 | 20 | 240 | 2,083 | 16.67 |
| 200,000 | 375 | 20 | 240 | 833 | 6.67 |
Both examples are realistic and show the potential to compound the problem of recovery if no additional workers are brought in to complete the loss adjusting. Given the scope of the storm and every policy requiring work, the first example is more likely.