Does the size of a home impact its vulnerability to hurricane winds? AIR researchers think so, and data confirm it.
Analysis of detailed company claims data for high-value homes from recent hurricane events show that building vulnerability (as characterized by a damage ratio, which is defined as the ratio of the repair cost to the replacement value) decreases with increasing gross area, or square footage. Plausible explanations for this inverse relationship include:
- An increase in building resistance of larger homes through the presence of better secondary risk mitigation features and maintenance
- A change in the relative replacement value of different building components
- A change in wind loads because of differences in building and roof geometry as buildings increase in size.
When we look at the vulnerability of buildings to externally applied loads, there are two parts to the equation: building resistance and the imposed loads. The reduction in vulnerability of large homes due to the resistance piece of the puzzle (first bullet point above) can be captured in the existing version of the AIR U.S. hurricane model through the input of appropriate secondary risk characteristics. More recently, however, AIR engineers have conducted a series of experiments using computation fluid dynamics (CFD) to understand the reduction in wind loads with increasing gross area when coupled with increased complexity in roof geometry.
The focus on roofs is a natural one. Post-hurricane damage surveys suggest that a significant driver of insurance claims is damage to roofs. This damage may be caused by overloading due to pressure, fatigue loading due to turbulence, or debris impact.
Data show that larger, high-value homes tend to have more complex footprints and roof geometries in comparison to their average-size counterparts. Idealized "virtual" buildings representing each type (average and high-value) were modeled. The added complexity of the larger, high-value homes was captured by changing the number of walls, corners, and the roof type (number of hip and gable ends). Our findings show that as the structural square footage and consequently complexity of the roof increases, the fraction of the total roof area that is subjected to damaging critical pressure coefficients decreases. This is because of flow modification due to the structural complexity (third bullet point above).
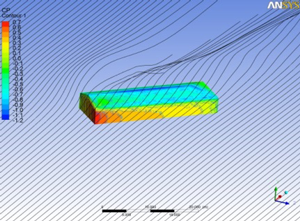
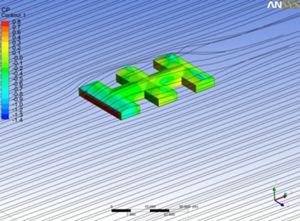
Different negative pressure thresholds were established-not with the implication that these levels produce damage, but to signify that the portions of the roof with mean pressure coefficients beyond these thresholds are probably areas where failures of roof covering, components, or sections are most likely to occur.
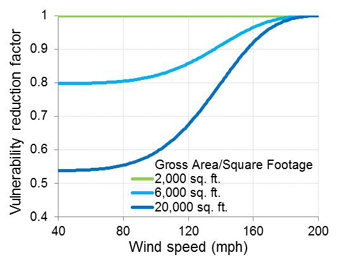
Relative building vulnerability of homes of different square footage normalized to average-size homes
The graph to the right shows a plot of the relative vulnerability, by wind speed, of homes of different square footage-normalized to a home of 2,000 square feet. A distinct reduction in vulnerability was noted for homes with a square footage of more than 2,000 square feet. It must be noted however,that the decrease in vulnerability is asymptotic-once the square footage is beyond a certain value, there appears to be no further reduction in vulnerability. No reduction in vulnerability, for example, is seen for homes larger than 22,500 square feet. Note,too, that as wind speeds increase, the mitigative effects of square footage decrease and ultimately disappear.
Findings from this research have been used to inform AIR's U.S.hurricane model update scheduled for release this summer in Touchstone® 3.0. It should be noted that this methodology captures the reduction in the vulnerability of high-value homes purely from the standpoint of external pressures or loads. The reduction in vulnerability due to the presence of superior features should still be captured by inputting those secondary risk characteristics directly into Touchstone.
If you would like to know more about computational fluid dynamics, read our AIR Current, Where the Wild Winds Blow, Part I