Florida has not seen a single hurricane landfall in ten years, and has experienced hurricane landfalls in just five years of the last twenty. People are asking how unusual (or usual) this is, and if we see any similar hurricane "droughts" in AIR's stochastic catalog. One way to look at questions like these is to examine the frequency distribution of Florida hurricane "hit years" over a few decades in both historical and stochastic catalogs.
We used a rolling time window technique to generate the hit year frequency distribution. To calculate a 20-year hit frequency distribution for the 1900–2014 historical catalog, we moved a 20-year window and found the resulting distribution in our catalogs. First, we identified each year as a 1 (hit year) or 0 (no landfalls) depending on whether there was at least one Florida landfall: 1=hit and 0=null. Second, we counted the number of hits for years 1-20. Third, we counted the number of hits for years 2-21 (i.e., rolling the 20-year window forward), and so on, until years 96-115. Finally, we tallied these counts to generate the hit year frequency distribution over 20 years. A range of window lengths, from 20 to 50 years, was examined for both AIR's stochastic catalog and the historical catalog for Florida. Only the 20-year and 50-year window results for the historical catalog are shown in Figure 1.
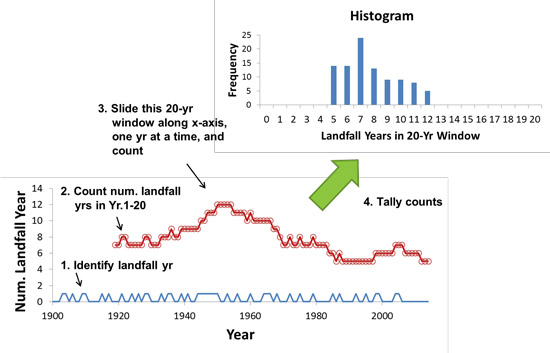
Figure 1. Frequency distribution of Florida landfall years ("hits") for a 20-year rolling window in the historical catalog. (Source: AIR)
We've seen five hit years over the last 20 (last red dot on the right in Figure 1). How often have we seen a frequency like this in the historical catalog? The answer is 14 (first blue bar in the Figure 1 histogram), or roughly 15 out of 100 times (or 0.15). But what about the stochastic catalog? The frequency of such a state in our 50K stochastic catalog is seven out of 100 times (or 0.07). That is on the low side comparatively, but not entirely unlikely since it is within the 95% confidence level. The frequency of having 14 landfall years out of a 50-year stretch (again, the current state) is 0.02 in the historical catalog. It is also 0.02 in the stochastic catalog.
Many periods with distributions similar to the historical data can be found in AIR's stochastic catalog. We can compare these periods with those found in AIR's historical catalog by employing the Spearman's rank correlation technique (a coefficient used to discover the strength of a link between two sets of data). For distributions generated using 20-year window, 25% of the total cases generated from the stochastic catalog have the Spearman rank correlation of better than 0.89 against the historical catalog. For those generated using 50-year window, 25% of them have the correlation of better than 0.77.
Figure 2 visualizes such similarity. Using a 20-year window, the distribution generated from the historical catalog (blue bars in left plot) is unimodal (also seen in Figure 1), and we can see that a period in AIR's stochastic catalog produces similar distribution (red bars in left plot). Using a 50-year window, an interesting bimodal distribution is found in the historical catalog (blue bars in right plot). More interestingly, such a signal is well-captured in a sample from our stochastic catalog (red bars in right plot).
To summarize, the hotly-debated hurricane frequency pattern over the past few decades is reproducible using the AIR stochastic catalog.
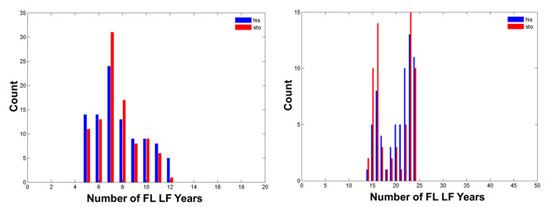
Figure 2. Comparison of historical (blue) and stochastic (red) frequency distributions of Florida landfall years generated using 20- (left) and 50-year rolling windows (right).
Note that in AIR's U.S. hurricane model, the number of landfalls for simulated storms in a year is generated from a negative binomial distribution with certain additional constraints applied. This process is called constrained Monte Carlo sampling. The current AIR model assumes that there is no dependence from one year to another; in other words, every year in the catalog has an equal probability of occurrence. As a result of this independence assumption, stretches of years with hurricane landfalls or stretches with landfall droughts are not explicitly modeled; instead, inter-annual variability is intrinsically controlled by the negative binomial distribution and constrained Monte Carlo sampling.