


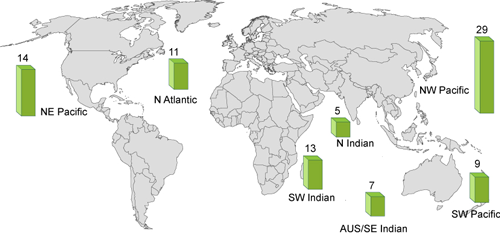
On average, 80-90 tropical cyclones (TCs) form in the world's ocean basins each year-and the numbers are fairly consistent from year to year. This would suggest that, in any given year, if one basin fails to produce its usual output, then another basin may yield a surplus.
A 2007 study by Frank and Young demonstrated that the apparent global uniformity of tropical cyclone formation is in fact a myth-there is more inter-annual variability in the observed global annual storm count than one would get from synthesizing a total storm count based on randomly sampling the historical data. Dispelling the myth, however, does not preclude correlations between specific basins.
For example, in looking at the North Atlantic (NATL) and Northwest Pacific (WPAC) basins, which are two of the most productive, we do see some interesting connections. Namely, when seasonal counts are high in one basin, they tend to be low in the other. In fact, 16 of 32 seasons from 1977 to 2008 show this negative correlation.
If we start to dig a bit more deeply, we find even more significant anti-correlation. When we consider storm days instead of just storm numbers, 21 of the 32 years show this opposite behavior and the correlation is -0.409, which is significant at the 95 percent confidence interval.
When we look at ACE (accumulated cyclone energy), then 23 of the 32 years show a statistically significant negative correlation: -0.398. The relationship with ACE reflects the influence of strong storms. That is, a plentitude of very intense typhoons in the Northwest Pacific tends to be accompanied by a season of weaker storms in the North Atlantic. The correlation for Category 4 and 5 storm periods is -0.452, with 21 of 32 years exhibiting the opposite behavior.
To understand these relationships a bit more, we can look at climate signals that drive behavior in individual basins.
The El Niño Southern Oscillation (ENSO) is a phenomenon almost always mentioned to explain (at least partially) tropical cyclone activity. We know that when the ENSO index is positive, there is strong wind shear over the main development region of the North Atlantic and frequent/strong tropical cyclone activity is suppressed. In the Northwest Pacific, a positive ENSO index means that warm ocean water has spread eastward across the eastern tropical Pacific. This warm water expansion allows 1) more storms to form in the Northwest Pacific and 2) more intense storms because they have a lot more room and time to grow.
The correlation for the 32 years we examined is in fact very high for both basins: -0.433 for the North Atlantic and 0.688 for the Northwest Pacific! Additionally, nearly fifty percent of the seasons can be characterized as either El Niño or La Niña. Thus,because ENSO is a relatively frequent occurrence and because the phenomenon has strong impacts on tropical cyclone genesis in the individual basins, the activity between the North Atlantic and the Northwest Pacific is (negatively) correlated to a large degree.
Tropical cyclone catastrophe models of course require more than just accounting for correlated storm formation among basins. They require accounting for correlations in terms of landfall.
In this respect, the picture between the North Atlantic and Northwest Pacific remains unresolved, at least for now. Interestingly, initial investigation shows a positive correlation between landfall activity in the U.S. and landfall activity in Japan. Understanding that behavior will require more than just evaluating ENSO indices, as climate signals like the North Atlantic Oscillation, which influence steering currents, are likely playing a role.
Correlation by itself does not imply causation, and it is the latter that we as catastrophe modelers must understand in addition to the statistics to create globally consistent models-an effort that's under way here at AIR.
