


Effect of Extratropical Transitioning on Pacific Typhoons
May 14, 2009
May 14, 2009
Editors Note: The transition of tropical cyclones to extratropical cyclones is a relatively common occurrence and is one that occurs in both the Atlantic and Pacific Ocean basins. The impact of a transitioned storm on insured losses—particularly in terms of precipitation-induced flooding—can be significant. In this article, AIR Principal Scientist Dr. Peter Sousounis and Scientist Jason Butke discuss the phenomenon of extratropical transition in the context of Japan typhoons, as well as the challenges of forecasting it and its impact on precipitation…and insured losses. Enhancements to the AIR Typhoon Model for Japan, scheduled for release later this year, will include the explicit modeling of extratropical transition and losses resulting from precipitation-induced flood.
Introduction
Tropical cyclones are low pressure systems characterized by high winds and heavy convective rainfall. They have a warm core (that is, warmer than the surrounding environment) and surface temperatures across their width are relatively uniform. Importantly, tropical cyclones derive their energy from warm ocean water that moistens and destabilizes air so that it rises, cools, and condenses to forms clouds and precipitation.
Extratropical cyclones are also low pressure systems characterized by high winds and heavy, often steady rainfall. But extratropical cyclones differ from tropical cyclones in that they occur in middle and high latitudes, are cold-core (colder than the surrounding environment), and have large horizontal surface temperature differences (“baroclinic”). An important distinction from their tropical counterparts is that extratropical cyclones derive their energy primarily from horizontal temperature gradients in the atmosphere and not from warm ocean water; warm air is mechanically lifted over cold air to form clouds and precipitation.1
While tropical cyclones and extratropical cyclones are distinctly different phenomena, it is not unusual for the former to evolve, or transition, into the latter.2 At some point in its predominately east-to-west track in the tropics, a tropical cyclone may begin to move poleward where it encounters cooler sea surface temperatures and increased vertical wind shear associated with the mid-latitude westerlies. These and other factors cause the tropical cyclone to increase its forward speed, lose its symmetric cloud shield and, at times, reintensify rapidly into a powerful extratropical cyclone.
Extratropical transitioning cyclones occur in most tropical ocean basins. Indeed, approximately 45-50% of tropical cyclones in both the Northwest Pacific and North Atlantic basins undergo extratropical transition.3,4 The resultant storm typically has a larger wind and precipitation footprint than it did as a tropical cyclone—and it can still pose a serious threat to land and sea interests.
Challenges for the Forecaster
Forecasting extratropical transition and its downstream impacts can be challenging and costly. While considerable progress has been made in recent years in forecasting the track, intensity and even wind field of tropical cyclones, transitioning cyclones are more difficult. Additionally, because extratropical cyclones typically move much faster and exist in a more dynamic environment, an error in the forecasted transition time by even a few hours can mean a dramatic error in forecasted location and speed of the system. Even sophisticated numerical weather prediction models have difficulty with accurately simulating extratropical transition.
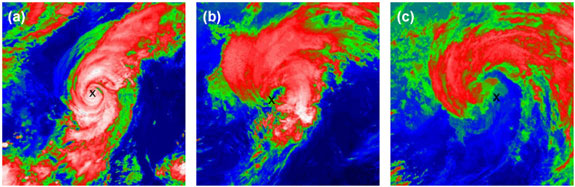
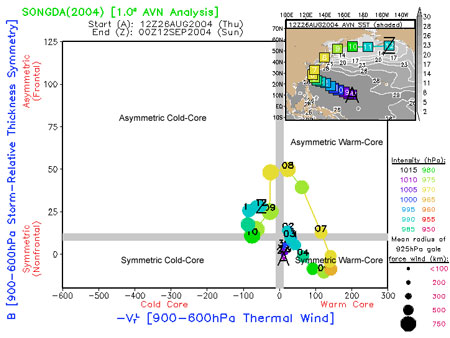
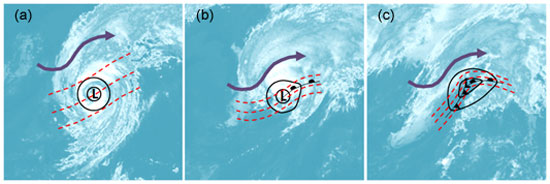
Nevertheless, some basic tools are available to help forecast and identify when transition will happen and, retrospectively, when it occurred. These range from very subjective analyses of surface data and satellite imagery to a more objective “phase space” approach developed by Hart (2003). The amount of uncertainty is potentially large when comparing results from different agencies using different approaches. Typhoon Songda (2004) offers a good example. Satellite imagery in Figure 1a-c shows extratropical transition occurring around 1200 UTC on September 7th, while the phase space diagram in Figure 2 shows transition occurring around 0600 UTC on the 8th.5 The Japan Meteorological Agency (JMA) reported that transition had occurred at 0000 UTC on the 8th.
 Dr. Peter Sousounis
AVP, Director of Meteorology
 Jason Butke
Clearly, the choice of technique will have implications for evaluating extratropical transition and where, when and, more importantly, the extent to which it will impact regions downstream. The nature of those impacts, in the context of a case study of two Japan typhoons, is discussed below.
Impact of Extratropical Transition on Precipitation
Mature tropical cyclones—at least those in low wind shear environments—typically exhibit a very symmetric precipitation shield. Convergence and convection—both associated with thunderstorm activity in the eyewall—are greatest near the radius of maximum winds (Rmax) and it is here that the most intense precipitation occurs. Outward from the Rmax, precipitation rates generally decay, with most of the precipitation falling within the radius of gale-force winds (Matyas 2006). During extratropical transition, increased vertical wind shear forces the precipitation shield to become highly asymmetric with most of the precipitation falling north and east of the storm center. Additionally, colder, drier air enters, or “is entrained,” into the southern and western parts of the storm, which erodes the precipitation over the center.
These features can be seen more clearly in Figure 1. Figure 1b shows the dry air entrainment (in greens and blues) south of the storm center, which is denoted by “X.” By Figure 1c, the precipitation shield has become even more asymmetric, with dry air entrainment to the north and south. This asymmetric precipitation shield is typically larger than it was when the system was tropical, but hourly precipitation rates are generally lower.6
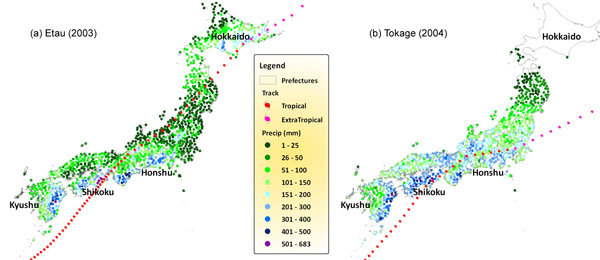
Typhoons Etau (2003) and Tokage (2004) had similar tracks and intensities, but Tokage was already beginning to transition as it made landfall on Japan’s main island of Honshu, while Etau transitioned farther north over Hokkaido. Observed wind speeds were similar for the two events but Tokage caused substantially more flooding, which claimed nearly 100 lives. Figure 3 demonstrates that Tokage and Etau’s observed precipitation totals were similar over the mountains of the southern islands of Kyushu and Shikoku, but that Etau was noticeably drier across Honshu, especially the northern half.
Impact of Extratropical Transition on Losses
The economic impacts of tropical cyclones that have transitioned to extratropical can be dramatic.7 One reason is that buildings and their owners in the middle and high latitudes may be less well prepared for storm-force winds and heavy precipitation. Whether due to building codes that are less strict, a lack of evacuation strategies and emergency preparedness, or poor forecasting, a transitioned storm can have serious impacts.
Typhoons Tokage and Etau resulted in significantly different levels of damage and loss. The JMA (http://agora.ex.nii.ac.jp/digital-typhoon/) reported that Etau inundated 2,398 houses, while Tokage inundated 55,455 houses. Wind losses were also very disparate between the two storms. The General Insurance Agency of Japan (GIAJ) reported insured losses of 5.1 Bn JPY for Etau and 88.5 Bn JPY for Tokage.
There are numerous facts that support the notion that the extratropical transition of Tokage contributed more significantly to the greater damage than did any differences in intensity or storm path. Table 1 summarizes a comparison of key features at and post-landfall for the two typhoons. First, it is evident that both storms were nearly equally strong from a central pressure and gradient wind perspective. Second, maximum rainfall amounts8 (i.e., at any given station) were also very comparable, so this too cannot explain Tokage’s higher level of damage. Finally, while the two storms took slightly different inland paths, which can explain loss differences from a proximity-to-exposure standpoint, the path differences per se were not as important as what happened because of them. Specifically, because Etau traversed more land before transition, it had lost its primary source of energy and moisture—that is, the ocean. Tokage, on the other hand, had essentially completed transition as it made its way across Honshu and so was able to extract energy and moisture not from the ocean, but rather from the free atmosphere.
| Characteristic | Etau (USD Millions) | Tokage |
|---|---|---|
| Landfall Central Pressure (hPa) | 950 | 950 |
| Landfall Maximum Winds (kts) | 75 | 80 |
| Landfall Latitude | 33.36 | 33.73 |
| Landfall Radius of Max Winds (km) | 111 | 122 |
| Landfall Max Hourly Precip (mm/hr) | 25 | 40 |
| Landfall Outer Storm Radius (km) | 250 | 375 |
| Landfall Forward Speed (kph) | 22 | 55 |
| Maximum Precipitation (mm) | 683 | 550 |
| Transition Latitude | 42.8 | 35.9 |
| Landfall+12 Central Pressure (hPa) | 975 | 980 |
| Landfall+12 Maximum Winds (kts) | 45 | 60 |
| Wind Impact Index | 3777 | 5702 |
| Precipitation Impact Index | 7219 | 9610 |
| Completely Destroyed (Houses) | 28 | 7776 |
| Halfly Destroyed (Houses) | 27 | 10955 |
| Partially Destroyed (Houses) | 559 | 14323 |
| Inundation Above Floor (Houses) | 389 | 41132 |
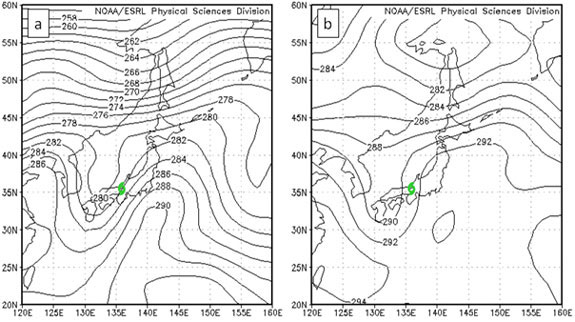
A closer comparison of the two typhoons reveals other differences related to extratropical transition that support the disparity in the losses. For example, note that Tokage’s precipitation was considerably higher across the northern half of Honshu, including the Tokyo region, at a time when it had already completed transition. The heavier precipitation is supported by stronger and more extensive warm advection (horizontal transport) north and east of its path. The presence of a stronger baroclinic zone (steep horizontal temperature gradients) surrounding Tokage (Figure 4), as well as stronger and broader (southerly) winds despite higher central pressure 12 hours after landfall, certainly contributed to the stronger warm advection. The extensive warm advection contributed, in turn, to precipitation amounts from Tokage that were heavier than Etau’s along the northern coast of Honshu even though Etau hugged the northern coast.
It is worth noting that Etau did ultimately transition while it was crossing Hokkaido. Then and only then did it regenerate heavier amounts of precipitation. Indeed, the heaviest damage and losses from Etau occurred primarily over Hokkaido.
Extratropical Transition: The Physical Process
Various authors have described the extratropical transition process in detail (Klien et al. 2000; Ritchie and Elseberry 2001; Jones et al. 2003; Kitabatake 2007, 2008). Typically, in the first stage, as the tropical cyclone moves poleward, it encounters colder water and increased horizontal or latitudinal temperature gradients (Figure 5a). The colder water reduces the surface sensible and latent heat fluxes, which are responsible for extracting the energy from the environment (ocean) and converting it to storm energy.
In the second stage, as shown in Figure 5b, the cyclonic flow of the tropical cyclone distorts the temperature pattern such that warm air is advected (horizontally transported) northward on the east side and cold air is advected southward on the west side. The cold air advection on the west side erodes the convection on the northwest side of the tropical cyclone, causing it to lose its symmetric appearance. The cold air, as it continues to move southward, spirals inward towards the center from the southwest and may completely erode the cloudiness in that quadrant—resulting a “dry slot.” The warm advection on the east side, results in this warmer, moister, and lighter air being lifted over the colder air farther north (called “overrunning”). The lifting of this air maintains the deep cloudiness and precipitation over the northwest and northeast quadrants as the process continues (see Figure 1c). The weakening of the tropical cyclone and the concomitant loss of cloud symmetry are characteristic of almost all extratropical transitioning events.
Importantly though, as these processes continue into the third stage, the cyclone taps a new source of energy (baroclinic). As the cyclone continues to move northward into stronger environmental temperature gradients, its own winds pack the isotherms together to create fronts, which further increases the wind speeds along these fronts. These frontal motions help to lift warm, moist air to cause clouds and precipitation, and help ventilate the storm aloft, causing the central pressure at the surface to drop. As the available potential energy is released, it is converted to storm energy. The transitioning cyclone begins to reorganize and may reintensify.
Closing Thoughts
Extratropical transitioning is the process whereby tropical cyclones evolve from systems that derive their intensity from ocean heat energy to systems that derive their intensity from atmospheric potential energy.
The strength of the transitioned storm can be comparable to that from before. Importantly, however, the footprint of storm characteristics and hence their impact can be significantly larger. From a damage estimation perspective, therefore, understanding the process of extratropical transition and the ability to forecast when and where it will occur can help better anticipate and prepare for the losses that can result.
References
Hart, R. E., 2003: A cyclone phase space derived from thermal wind and thermal asymmetry. Mon. Wea. Rev., 131, 585–616.
——, and J. L. Evans, 2001: A climatology of extratropical transition of Atlantic tropical cyclones. J. Climate, 14, 546–564.
Jones, S., and Coauthors, 2003: The extratropical transition of tropical cyclones: Forecast challenges, current understanding, and future directions. Wea. Forecasting, 18, 1052–1092.
Kitabatake, N., 2008: Extratropical Transition of Tropical Cyclones in the Western North Pacific: Their Frontal Evolution. Mon. Wea. Rev., 136, 2066-2090.
Kitabatake, N., 2008; Extratropical Transition of Typhoon Tokage (0423) and Associated Heavy Rainfall on the Left Side of Its Track over Western Japan. Papers in Meteorology and Geophysics, 59, 97–114.
Klein, P. M., P. A. Harr, and R. L. Elsberry, 2000: Extratropical transition of western North Pacific tropical cyclones: An overview and conceptual model of the transformation stage. Wea. Forecasting, 15, 373–396.
Matyas, C., 2006: Analyzing Tropical Cyclone Rain Shields According to Storm Size. 27th Conference on Hurricanes and Tropical Meteorology, Monterey, CA.
Ritchie, E. A., and R. L. Elsberry, 2001: Simulations of the transformation stage of the extratropical transition of tropical cyclones. Mon. Wea. Rev., 129, 1462–1480.
Endnotes
1 For the interested reader, the physical process of extratropical transition is explained in the sidebar below.
2 Note that cold-core lows can also spawn tropical cyclones, though this is primarily a case of weak extratropical features providing the initial trigger for eventual tropical cyclogenesis, rather than a strong extratropical cyclone transitioning into a strong tropical cyclone.
3 Japan Meteorological Agency best track dataset 1951-2008; and Jones 2003 using 1971-1999 HURDAT.
4 Hart and Evans, 2001.
5 Other models show transition occurring as early as 1200 UTC on the 7th.
6 Transitioned tropical cyclones can reintensify rapidly when they interact or merge with pre-existing mid-latitude cyclones. A recent and dramatic example is 2008’s Hurricane Ike, which caused large wind losses in Ohio long after it had lost its tropical characteristics. During this time, convective frontal precipitation can be quite heavy.
7 Many specific examples are cited in Jones et al. (2003).
8 Etau moved considerably more slowly than Tokage, which more than compensated for the lower maximum hourly precipitation rate. Given that duration is a key contributor to both flood (and wind) damage, this feature also does not support the damage loss discrepancy.
