


2019's Atlantic Hurricanes: A Little More than We Bargained For
Dec 18, 2019
Although they are improving all the time, seasonal hurricane forecasts are inherently uncertain. An average Atlantic hurricane season will see approximately 12 named storms, of which six will reach hurricane strength and three will become major hurricanes (i.e., a Category 3–5 on the Saffir-Simpson scale), according to the National Oceanic and Atmospheric Administration (NOAA). This year’s pre-season forecasts predicted slightly above-average activity from named storms (9 to 16) but close to average numbers of hurricanes (4 to 7) and major hurricanes (2 to 4).
Climate Indicators
Many factors influence hurricane activity. Among the most prominent are the El Niño-Southern Oscillation (ENSO), the Atlantic Multidecadal Oscillation (AMO), the North Atlantic Oscillation (NAO), and the Madden-Julian Oscillation (MJO).
For the Atlantic, El Niño (the warm ENSO phase) increases vertical wind shear over the Main Development Region (Caribbean Sea), which inhibits tropical cyclones from intensifying or forming. At the outset of the year, the ENSO was neutral to slightly warm.
The AMO—alternating warm and cool phases of North Atlantic sea surface temperatures that can each last for 20 to 40 years—was positive (warm) this year (as it has been since the mid-1990s) and peaked during August/September. More severe hurricanes tend to form during the AMO’s warm phases than in its cool phases.
 Peter Sousounis, Ph.D.
Vice President and Director of Climate Change Research
Edited by Jonathan Kinghorn, CEEM
• 2019 saw four named storms form within a six-day period in September, and the fifth and sixth Atlantic Basin Category 5 storms in four years.
• This was the third consecutive year in which a storm moved across land at less than 5 mph.
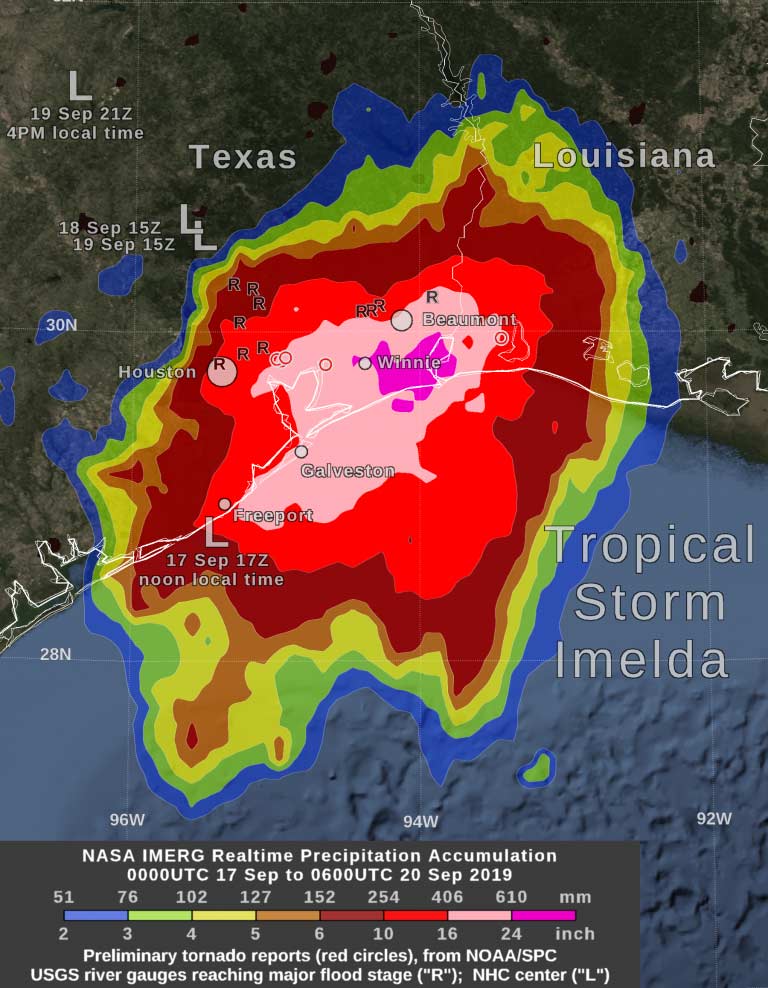
• Imelda came ashore barely qualifying as a tropical storm, but was the third slow, wet storm to impact the U.S. in as many years.
The NAO reflects differences in surface sea-level pressure and impacts the intensity and location of the North Atlantic jet stream and storm tracks, resulting in changes in temperature and precipitation patterns. The NAO was generally negative in 2019; during its negative phases Atlantic hurricanes are more likely to make landfall in the Gulf of Mexico rather than the U.S. East Coast.
Finally, the MJO—which NOAA describes as “an eastward moving disturbance of clouds, rainfall, winds, and pressure“—had a Western Hemisphere peak in September. In such a convective phase the MJO enhances rainfall. Its timing over the Atlantic Basin this year could have contributed to the six-day hyperactive period described in the section, “An Active Peak.”
A Slow Start
The development of Subtropical Storm Andrea in late May made this the fifth year in a row in which a tropical or subtropical cyclone has developed before the official start of the season on June 1. But, as in 2018, no tropical cyclones formed in June and it was July 13 before the second named storm of the year, Barry, achieved Category 1 status. Barry made landfall near Intracoastal City, Louisiana, the same afternoon, but soon weakened and the season continued quietly. In early August, however, as the peak of the U.S. hurricane season approached, NOAA forecasters noted that ENSO-neutral conditions more favorable for above-normal hurricane activity were developing.

Hurricane Dorian
Activity in the Atlantic began to ramp up spectacularly when Tropical Storm Dorian formed on August 24 to the east of the Lesser Antilles. Dorian intensified into a Category 1 hurricane on August 28 before making landfall on St. Thomas, U.S. Virgin Islands. North of the Virgin Islands it encountered more favorable conditions for development and began to intensify rapidly. On September 1 it attained Category 5 status just before making landfall on Great Abaco Island in The Bahamas as the most intense hurricane to affect the area in the modern record. Dorian’s forward speed soon decreased, and the storm became nearly stationary for about a day after it reached Grand Bahama Island on September 2.
Dorian began to drift northwestward on September 3, slowly gaining forward speed as it moved toward Florida, weakening as it went. Forecast at one time to strike Florida, Dorian changed direction abruptly and moved northeastward off the East Coast on September 3 and 4; some coastal parts of the Carolinas experienced hurricane-force winds in the days that followed. On September 6 the storm briefly made landfall on Cape Hatteras, North Carolina, as a Category 1 hurricane. It transitioned to a post-tropical cyclone but re-intensified to Category 1 status before making landfall in Nova Scotia then Newfoundland. Observed damage in the United States from Hurricane Dorian was limited but The Bahamas experienced devastation.
An Active Peak
Four named storms—Imelda, Jerry, Karen, Lorenzo—formed within a six-day period (September 17 to 23), perhaps with assistance from the MJO. Imelda was named on September 17, never attained hurricane status, and came ashore barely qualifying as a tropical storm. It was the fifth-wettest tropical cyclone on record in the U.S. and was the third slow, wet storm to impact the U.S. in as many years, after Harvey (2017) and Florence (2018). Imelda’s impact might have been even worse had it stalled, as Harvey did; instead, Imelda continued moving northward across western Louisiana, albeit slowly. Bookending this period, Tropical Storm Lorenzo reached hurricane strength on September 25. It intensified rapidly to Category 4 status the next day, with its maximum sustained winds increasing by 35 mph in just six hours. It remained in the Eastern Atlantic, however, and began turning northward as it weakened on September 27. Two days later Lorenzo intensified into the easternmost Category 5 storm on record, but it had weakened to an extratropical cyclone by the time it reached the British Isles on October 3.
According to NOAA, the 30-year (1981–2010) climatological average is for two named storms to form in the Atlantic Basin in October, and for one of those to develop into a hurricane. This October five named storms formed. One of these, Pablo, became a Category 1 hurricane at 18.3°W on October 27, breaking the record for hurricane formation that far east. Pablo remained in the Eastern Atlantic and weakened rapidly over the very cold waters in the region to become a tropical storm the next day; it did not make landfall. Rebekah reached its peak intensity on October 29 but became post-tropical the next day north of the Azores. The final named storm of the season, Tropical Storm Sebastien, was designated on November 19. Although it did intensify, it never quite attained Category 1 status, didn’t make landfall, and became post-tropical on November 25.
Key Takeaways
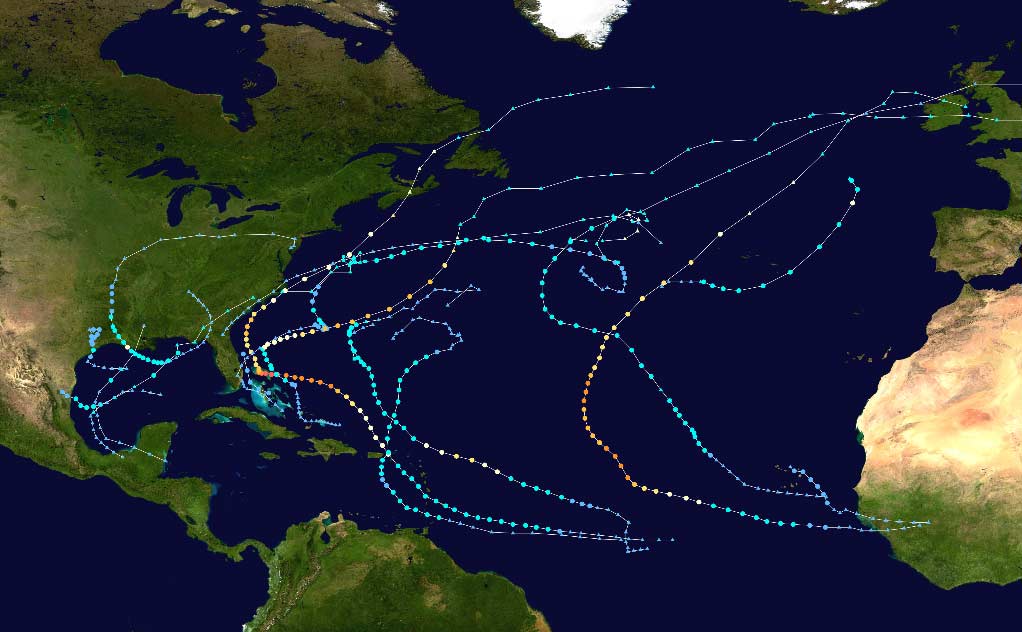
Most activity occurred at or after the season’s peak; the official season ended on November 30 with a grand total of 18 named storms, 6 hurricanes, and 3 major hurricanes. There were more named storms than the above-average number anticipated in the pre-season forecasts, but the totals of hurricanes and major hurricanes matched the 30-year average exactly. The season’s totals tie it with 1969 as fourth-most active hurricane season on record.
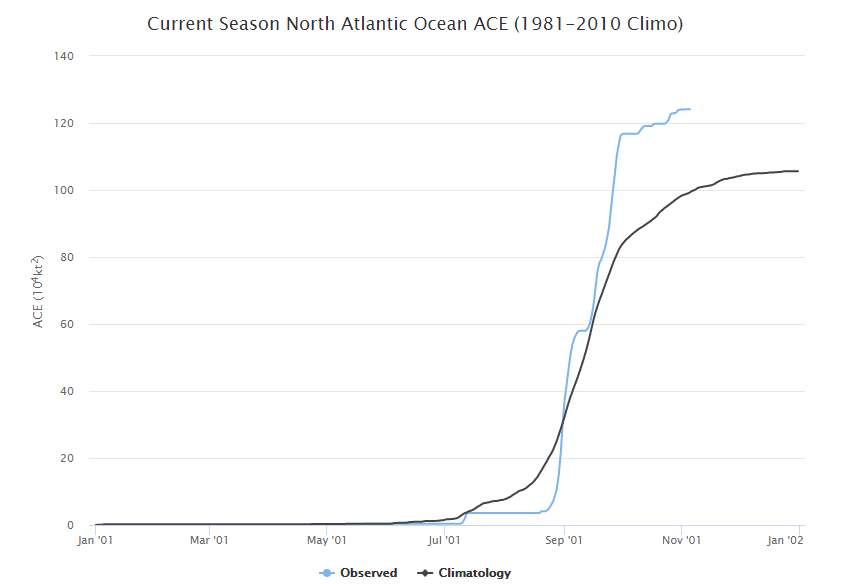
Numeric totals alone, however, are a poor indicator of a season’s severity. A more informative measure is the Accumulated Cyclone Energy (ACE) score. The unit of ACE is 104 knots2, and this wind-energy index’s seasonal score is the sum of the ACE values from each storm. A score below 66 is considered a below-average season. The 2019 season recorded a score of 130.425—well above the long-term mean. A hurricane season like this year’s with an ACE score higher than 120% of the median 1981–2010 ACE value, more than 13 named storms, and three major (Category 3 or higher) hurricanes meets NOAA’s definition of an above-average season.
Many of this year’s named storms were brief and weak. Nevertheless, there were aspects of several of 2019’s tropical cyclones that made this a memorable season. Five storms directly impacted the mainland United States—Barry, Dorian, Imelda, Melissa, and Nestor—which is comparable to the last few hurricane seasons. Of these five, Dorian and Imelda were the most damaging U.S. storms of the year.
Dorian will be remembered, however, for its destruction in The Bahamas. It passed through the islands as the fifth Atlantic Basin Category 5 storm in four years. In addition, its forward motion was excruciatingly slow, averaging barely 4 mph—and at times it was stationary. Dorian was the Atlantic Basin’s slowest-moving Category 5 storm on record. The double whammy of extreme intensity and sloth subjected Grand Bahama Island, which is not quite 70 miles long, to the full fury of a major hurricane for 40 hours—and for 15 of those hours Dorian was a Category 5 storm.

A growing number of peer-reviewed scientific articles have noted that, in recent years, tropical cyclones are moving more slowly over water and even more so over land. This was the third consecutive year in which a storm moved across land at less than 5 mph. Some have suggested that this slowing down might be the result of climate change. Dorian and Imelda remind us that such slow-moving tropical cyclones impact the areas they pass through for longer, thus subjecting them to more wind, storm surge, and rainfall.
The number of storms or their accumulated wind energy are useful indicators, but they don’t tell the whole story. It is certainly possible to have activity well above average but confined within the Atlantic Basin and resulting in no U.S. landfalling hurricanes. Wind is usually not the main cause of hurricane damage, water is; it only takes one notable storm—landfalling or bypassing—to cause record-breaking losses. For the United States, this year’s most costly named tropical cyclone, the soaker Imelda, never achieved hurricane status but was slow and wet.
When it comes to hurricane seasons, average rarely means unremarkable; there are usually surprises and learning points. This past hurricane season demonstrated once again the uncertainty and year-to-year variability in hurricane activity and the importance of considering multiple long-term views of risk.
