


Severe Thunderstorm Megadisaster Year in Australia—Are You Prepared?
Jan 24, 2018
Events: A year of severe thunderstorms in Australia
Model: AIR Severe Thunderstorm Model for Australia
Stochastic Year ID: #1872, Touchstone®
Affected area: Portions of all states, with a concentration in New South Wales
Estimated insured loss: AUD 9.3 billion
Annual insured loss exceedance probability: Approximately 1% (100-year return period)
In Australia, severe thunderstorms occur more frequently and cost more annually than any other atmospheric peril; they account for one-third of the country’s costliest natural disasters from the past 50 years, according to the Insurance Council of Australia (ICA). Severe thunderstorms can occur anywhere and at any time of the year.
Loss potential is increasing as property replacement values rise in the densely populated urban areas of Sydney, Melbourne, Brisbane, Perth, Adelaide, and Canberra. Nearly 90% of Australia’s population of more than 23 million live in urban areas.1 In addition, the number of insurable exposures continues to increase as development expands into previously unpopulated areas to accommodate growth. Australia has one of the highest population growth rates among developed countries, at 1.6% in 2017.2
Event Overview
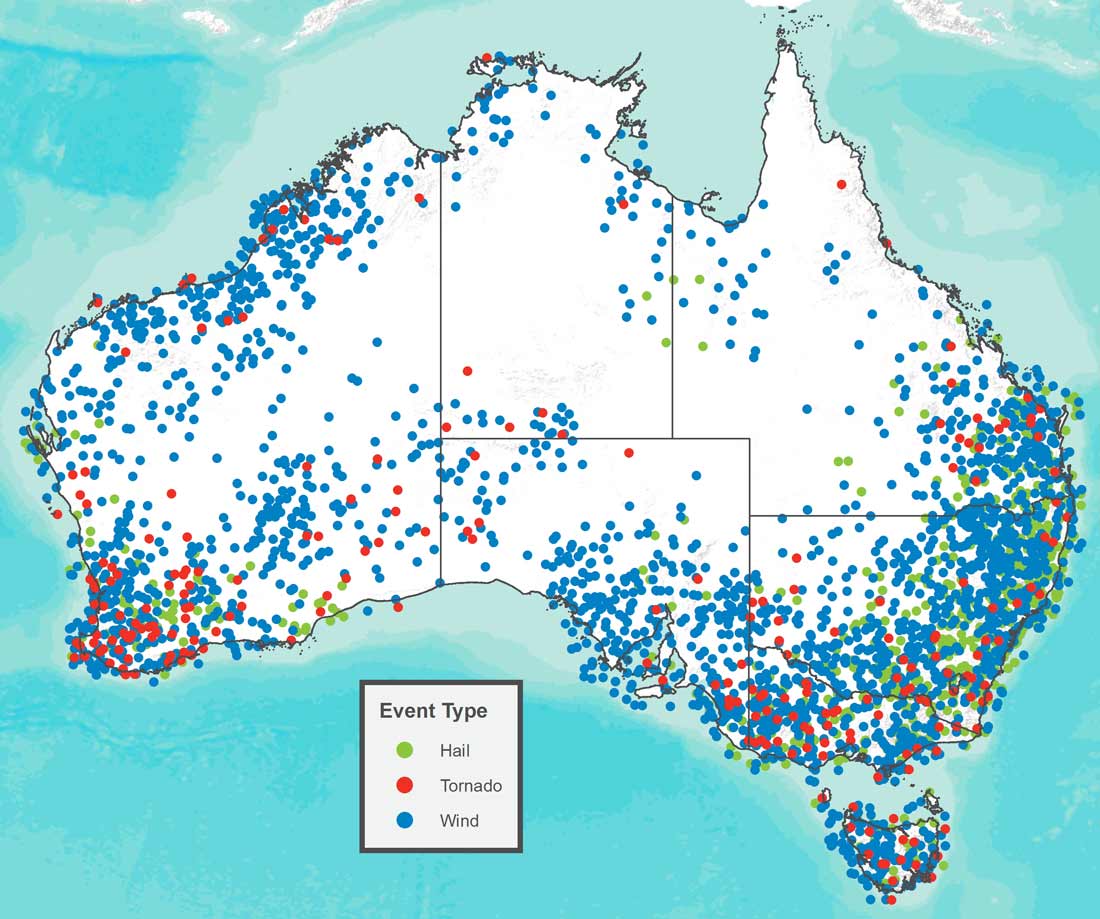
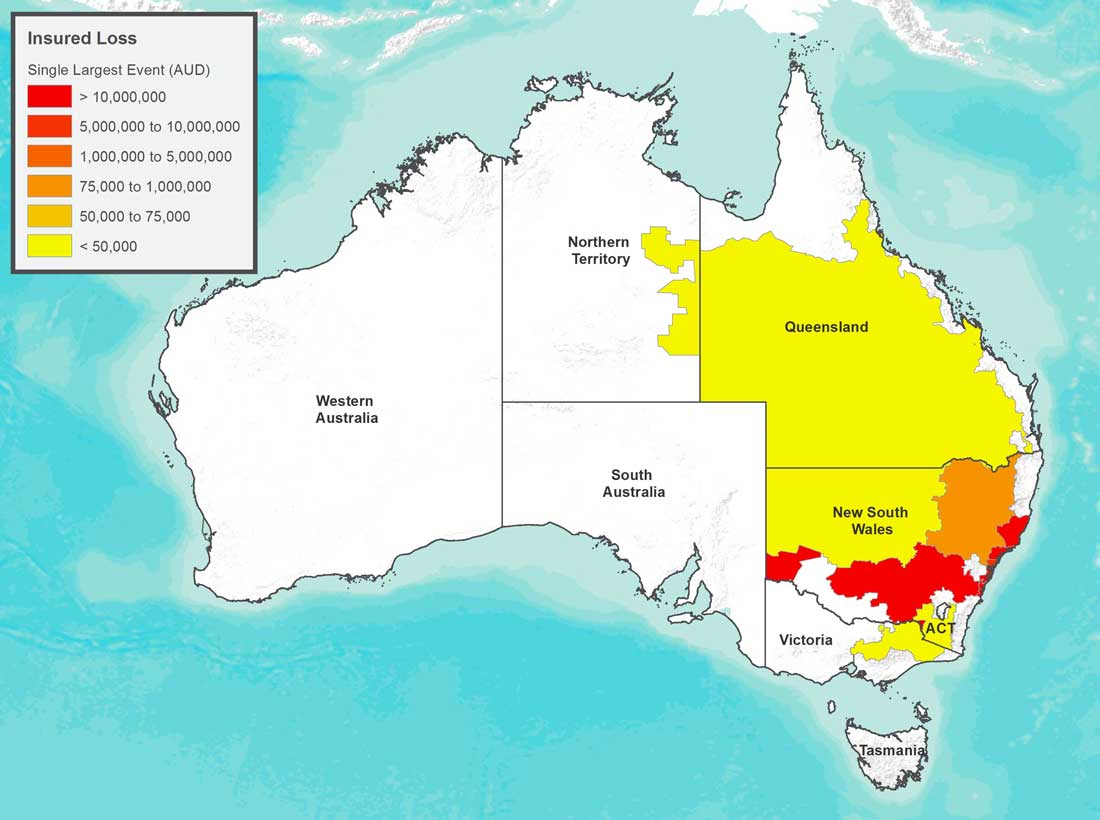
In this Megadisaster scenario, we look at a stochastic year producing a total insured loss from severe thunderstorms in Australia of AUD 9.3 billion, a sum that falls at an exceedance probability (EP) near 1% (100-year return period). The 170 severe thunderstorm events (each comprising one or more sub-perils of hail, straight-line wind, and/or tornadoes) that occur during this year impact all states (see Figure 1).

As seen in Table 1, all three of the highest insured loss events occur around the middle of the Australian summer. Early in November, a series of hailstorms strike New South Wales around Newcastle, Dubbo, Armidale, and Coffs Harbour. Insured damage to homes and businesses is reported at over 2.9 billion AUD—the second highest amount for this year.
Then the highest and third highest ranking events—predominantly hail and wind events, respectively—affect the Sydney area in New South Wales in December, resulting in a combined AUD 5.6 billion in insured losses to properties in that region. These two events occur within less than three weeks of each other, underscoring the risk of storm clustering in Australia.
The first of these two events, on December 5, affects a large portion of Greater Sydney, including many western, eastern, and northern suburbs, as well as the Central Business District. Wind causes extensive damage to roofs, siding, and windows. Gusts of 120 km/h overturn caravans and trailers and damage automobiles with wind-borne debris, while knocking down construction cranes, trees, and power lines, which in turn block roads.
Then, on December 21 through 24, a series of severe thunderstorms strike, with the first day being the most significant: a hailstorm hits high-value properties in Sydney’s Northern Beaches. Hailstones almost 12 cm in diameter pummel the region. The storm damages tens of thousands of houses, while thousands of cars sustain cracked or smashed windows, along with dents and other panel damage. Another strong hailstorm then hits the Southern Highlands and Illawarra regions of New South Wales, dropping hail almost 9 cm in diameter on communities south and west of Wollongong, including Shellharbour and Kiama.
Australia’s Severe Thunderstorm Setting and History
Large numbers of severe thunderstorms occur across every part of Australia every year, including the country’s most densely populated regions. Severe thunderstorms can occur year-round but are most common from September to March in the Australian spring, summer, and fall seasons, and they usually occur in the afternoon when temperatures are higher and the atmosphere is less stable due to warming from the sun. Severe thunderstorms are capable of causing loss of life, property damage, and large insured losses.
A severe thunderstorm can produce any of these sub-perils: tornadoes, wind gusts of at least 90 km/h, and hail measuring a minimum of two centimeters in diameter. Severe thunderstorms can impact a broad area, with a single event crossing multiple states, or their impact can be quite localized. All severe thunderstorm sub-perils that AIR models (see bullets below) can result in significant damage, and can create compound damage when wind drives hail to high velocities.
- Hail. On an average annual basis, hail is the sub-peril that causes the highest losses to property in Australia. Hailstorm outbreaks can last for several days and affect multiple states and territories, but individual swaths may last for just minutes and can devastate highly localized areas. Significant property damage usually occurs when hailstones are golf ball–size (>4 cm in diameter) and larger—hail in Australia has been recorded as reaching sizes larger than a cricket ball (>7 cm in diameter).
- Tornado. Tornadoes may not be the most frequent hazard in Australia, and they rarely exceed F2 intensity, but tornadoes that powerful do have the potential to cause significant damage. The most destructive tornado to impact Australia was the 1973 Brisbane tornado, which damaged more than 1,000 buildings.
- Straight-line wind. The most frequent yet often overlooked sub-peril is straight-line wind, which can cause significant losses. Damage from weak tornadoes is often mistakenly attributed to straight-line winds, but unlike tornadoes, a straight-line windstorm exhibits no circular motion because it lacks a central vortex. These events have wind speeds of more than 90 km/h with maximum wind speeds that can sometimes exceed 160 km/h, causing damage that can be as severe as that from a moderate to strong tornado.
One of the best data sets for understanding the distribution and frequency of severe thunderstorms in Australia is the Bureau of Meteorology (BOM) Severe Storm Archive, which is a database of storm spotter reports. From this data, we can see that Queensland, New South Wales, and Victoria have the most severe thunderstorms overall, but thunderstorms do occur in every state. All the sub-perils do not always occur together or even in the same proportions across the country. Looking at the relative proportion of storm reports by sub-peril and state (Figure 2), Queensland and New South Wales experience roughly equal proportions of straight-line wind and hailstorm reports, with a small fraction of tornado reports. However, when other states are analyzed, these proportions differ significantly. For example, South Australia and Western Australia experience much higher numbers of wind reports than hail. If the seasonal trends are analyzed, other interesting details emerge, such as the fact that South Australia and Western Australia experience most of their severe thunderstorm activity during the cool season, and they have more tornadoes than any other state.
The differences between states are due to the regional variations in the overall atmospheric conditions. Thunderstorms require three basic conditions for their formation: a humid air mass, atmospheric instability, and a source of lift for initiation. Severe thunderstorms are also associated with a fourth condition: vertical wind shear (change in wind speed and direction with altitude). Supercells—a type of thunderstorm responsible for the majority of severe weather—occur when high shear creates a rotating updraft, known as a mesocyclone.
Each sub-peril is associated with more specific condition variations. For example, for hailstones to grow larger, a strong storm updraft is necessary to keep them suspended in the cloud where they accumulate more ice layers. The updraft speed is directly related to the instability, so higher instability is associated with larger hail. In addition, cold temperatures aloft are required to have a layer of the storm that can grow hail stones. Areas that frequently experience atmospheric conditions with high instability are the east and north coasts during the summer months, due to the persistent warm, moist air interacting with colder air. The tropical northern areas of Australia typically are too warm for large hail growth, which is why severe hailstorms are much more common in eastern Australia.
Billion dollar losses from severe thunderstorms were once a rare occurrence in Australia, but no longer. The 2014 Brisbane wind- and hailstorm and the 2010 hailstorms in Perth and Melbourne each broke the billion-dollar mark. The 1999 Sydney hailstorm—the costliest natural disaster in Australia’s history—would cause nearly AUD 4.6 billion in insured losses if it were to recur today.
More recently, two sets of storms struck within just over three months of each other, with a combined estimated loss of more than AUD 1 billion, according to the ICA.3 On November 11, 2016, a severe thunderstorm struck the northwest of Victoria, eastern South Australia, and western New South Wales, bringing strong winds with gusts of almost 100 km/h, hail the size of golf balls in metropolitan Adelaide, and heavy rain, with reported claims of AUD 597 million. Then on February 18-19, 2017, a severe thunderstorm with high winds and hail up to the size of tennis balls impacted greater Sydney and the New South Wales coast, toppling trees and power lines and causing reported insured property losses of AUD 512 million.
Affected Exposure
Hail, tornado, and straight-line wind each have unique impacts on buildings, automobiles, and industrial facilities, as well as impacts to business interruption losses. While hail is the main driver of loss in Australia, wind and tornado sub-perils can still contribute significantly to losses across various lines of business (see Figure 4).
Most of Australia’s residential buildings are either wood frame or masonry; many having brick veneer—a type of construction commonly known as masonry veneer. Residential buildings are mostly single-family homes, 35% of which are masonry veneer, with significant popularity in the southeastern part of the country. Apartments and condominiums are found in larger cities where they make up about 30% of the residential building stock.
For overall construction, the ratio of wood frame to masonry buildings varies by region depending on the availability of wood (see Figure 5). Wood frame homes are predominant in Victoria, Tasmania, New South Wales, Queensland, and the Australian Capital Territory, while masonry is more likely to be used in Western Australia and the Northern Territory. South Australia has almost equal amounts of wood frame and masonry homes, with a slight dominance in the use of masonry.
Strong building codes were put in place after the devastation of Cyclone Tracy in 1974, so newer buildings are more resilient to high winds and wind-borne debris. Most homes are low-rise, so wind damage tends to impact building envelopes (roofs and exterior walls). With very high wind events, structural damage can be significant, notably for older buildings. A recent survey4 from the University of Queensland showed that a majority of wind-related roof failures occurred in older houses that did not meet modern codes.
The commercial and industrial building stock in Australia is predominantly concrete and steel. Mid- and high-rise commercial buildings tend to have higher levels of engineering attention and are therefore more resistant to wind damage than their low-rise counterparts. Light metal construction dominates the agricultural building inventory in Australia and these are extremely vulnerable to wind and hail.
Hail vulnerability: a very Australian issue
As seen in Figure 2, hail is particularly prevalent along the southern and eastern coast—areas that are highly populated. Although windows and cladding can be damaged by hail impact, most of the residential building damage from hail occurs to roofs and roof coverings. Damage to roofs occurs primarily on a building’s windward side where hail has the most direct impact. The roofing material most common to single-family homes in Australia is tile, which may crack or shatter from hail strikes. Metal sheeting—vulnerable to denting and pitting—covers the majority of the non-tile residential roofs.
Large commercial buildings often have glass facades, thereby making their windows and cladding vulnerable to damage from hail events, especially when coupled with strong straight-line winds.
Damage from hail typically affects the functional as well as cosmetic properties of building components. If either hail or wind causes functional damage to the exterior of a building, then rainwater can enter the building—water damage to internal components may include interior wall finishes and contents.
Automobile vulnerability
One of the biggest issues in a hailstorm is damage caused to automobiles. Most common is denting to the metal body. Windows and windshields may be damaged, and in a few cases can be destroyed, exposing the interior to rain damage. High horizontal winds can exacerbate hail damage to cars, driving higher impact velocities.
Even in instances when building damage was minor, hail can come so quickly and unexpectedly that the majority of cars in the path of the hailstorm can take some level of damage. For example, an event may happen in an evening rush hour with many cars on the road. Also automobile dealer lots are particularly vulnerable, where a great many new and used vehicles are commonly parked in an open space. AIR's severe thunderstorm model for Australia has hail damage functions for autos, with additional functions for auto dealerships.
Estimating the Impact
In this Megadisaster scenario, 170 simulated severe thunderstorms in Australia cause insured losses AUD 9.3 billion, a sum that falls at an exceedance probability (EP) near 1% (100-year return period). The costliest event, responsible for more than half of the total, is shown in Figure 7. The insured losses for the entire stochastic year are shown, by CRESTA, in Figure 8.
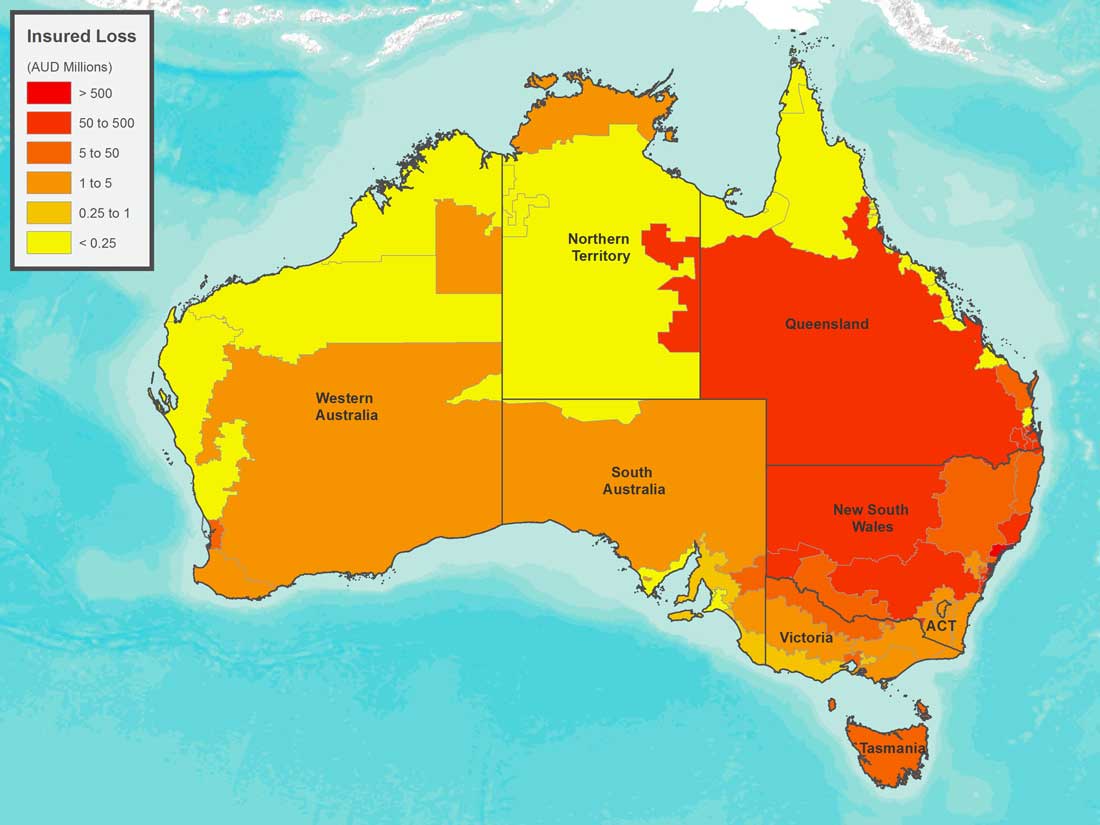
The 10 most costly events, shown in Table 1, account for AUD 9.1 billion, or more than 97% of total losses in this simulated year. These include November hailstorms in northeastern New South Wales, another December set of hailstorms in southeast Queensland, and February wind- and hailstorms primarily impacting Perth in Western Australia—spreading losses across the entire country. (See Table 1)
| # | Mo. | Day | Insured loss AUD Millions |
Top three affected CRESTAs, in order |
|---|---|---|---|---|
| 1 | Dec. | 21-24 | 5,057 | Sydney, Wollongong, Wagga Wagga/Griffith |
| 2 | Nov. | 5-6 | 2,948 | Newcastle, Dubbo/Armidale, Coffs Harbour |
| 3 | Dec. | 5 | 544 | Sydney |
| 4 | Dec. | 14-15 | 244 | QLD/NSW Center, Bundaberg, Brisbane |
| 5 | Oct. | 24-25 | 124 | Brisbane, Bundaberg, QLD/NSW Center |
| 6 | Sept. | 7 | 100 | Gold Coast, Port Macquarie, Coffs Harbour |
| 7 | Feb. | 28 | 49 | Perth, Wagga Wagga/Griffith, Central Coast/Gosford |
| 8 | Feb. | 20-21 | 45 | Dubbo/Armidale, Port Macquarie, QLD/NSW Center |
| 9 | Sept. | 22 | 40 | Wagga Wagga/Griffith, Interior VIC/NSW/SA, Canberra/ACT |
| 10 | Oct. | 11-14 | 26 | Brisbane, QLD/NSW Center, Geelong/Warrnambool/Gambier |
In this modeled year, the height of the summer storm season saw the vast majority of losses, with the month of December experiencing the greatest losses by far: AUD 5.8 billion—62% of the total for the year—with three of the top four storms. Losses for November were also high, totaling close to AUD 3 billion.
As seen in Figure 4, insured losses from hail are far higher at AUD 8.5 billion—91% of total losses—reflecting historical storm experience in Australia. Straight-line wind comes in a more distant second at AUD 784 million, although still significant. Tornadoes also contributed losses that could have noteworthy impact to regional portfolios.
Are You Prepared?
The various events in this megadisaster loss scenario exemplify the extensive and widespread damage that can result from severe thunderstorms—and sub-perils—in Australia. Other scenarios could produce equally comprehensive damage with similar levels of loss. Importantly, the scenario year detailed in this article is not an extreme tail event. The industry insured loss for severe thunderstorms has a modeled annual exceedance probability (EP) of about 1.0% (which equates to a 100-year return period); far greater losses are possible.
Responsible risk management includes acquiring a comprehensive and realistic view of risk, as well as preparing for a wide range of loss scenarios. Using model scenarios—such as this 1% EP year—to probe your portfolio's strengths and weaknesses will help you respond effectively when disaster does strike. Being attentive to best practices can help ensure that you achieve the most realistic loss estimates:
- Severe thunderstorm is a highly localized peril, so getting accurate exposure data, while challenging, is of utmost importance. Collect detailed information for the properties that make up your portfolio—including location and all primary building characteristics such as construction type, occupancy, building age, and height—and a true replacement value. Secondary features will help refine the loss results and help you get closer to the true vulnerability of the individual buildings.
- Use visual intelligence to understand your data. Geospatial analytics can provide rich and intuitive information on risk accumulations and how they relate to potential hazards, for more informed risk management.
- Touchstone can estimate losses separately for each of the three sub-perils of severe thunderstorm (hail, tornado, and straight-line winds). (Note that AIR's software does not allow "double counting"—attributing the same damage to more than one sub-peril—so users can never arrive at a total mean damage ratio that exceeds 100% for a given event.)
- Consider the potential for business interruption losses. Use catastrophe models to calculate business interruption after natural disasters—a potential source of significant loss—as a function of downtime, damage, building size, and architectural complexity.
- Consider the potential for increased losses due to demand surge. While not included in this scenario, catastrophe models can be used to calculate the additional losses due to demand surge as a function of the total industry loss for each event.
- Be aware of potential losses from non-modeled sources such as extreme flooding during some severe thunderstorm events, crop damage, fire following, and hazardous material leakage and associated cleanup costs.
- Finally, consider your loss ratio, or how your estimated losses compare to the "total insured value" in each affected area. While your losses may at first appear to be high, the loss ratio they reflect (even in the most severely affected region of this Megadisaster analysis, the loss ratio is less than 5%) should be entirely consistent with an infrequent but thoroughly plausible catastrophic event.
AIR's unique catalog structure allows users to simultaneously analyze multiple models across different perils, as well as across different regions. Looking ahead, AIR is developing models that can capture global correlations across atmospheric perils for an even more comprehensive view of the risk.
Closing Comments
What will be the next megadisaster surprise?
AIR models capture the behavior of physical phenomena and how those phenomena impact the built environment. They have been thoroughly validated using data from a wide variety of sources.
But no model can predict what the next megadisaster will actually be or when it will occur. The fundamental uncertainty makes it all the more important for companies to use catastrophe models to prepare for such losses. The full range of scenarios the models generate—simulating so many perils that impact so many places—provide a unique and important global perspective on an organization's overall risk. The careful analysis of model results can help risk managers prepare for many contingencies—thus ensuring that scenarios like the one presented here will not be entirely unexpected.
