


Is Your Wildfire Risk Management Going Up in Smoke?
Feb 22, 2018
Editor's Note: Wildfire risk is increasing in the western United States as development of the wildland-urban interface (WUI) grows to meet population demands. To help companies better understand their risk, make more informed decisions, develop more effective risk management strategies, and increase wildfire resilience, AIR has developed a new Wildfire Model for the United States anticipated for release in summer 2018.
The Wildland Urban Interface: Building in Harm’s Way
The bulk of property loss from wildfires occurs in a region called the wildland-urban interface (WUI), an area where human development meets undeveloped forests, grasslands, and chaparral. About one-third of all residential buildings in the contiguous United States are in roughly 220 million acres of the WUI, as well as several hundred thousand businesses and an estimated population of more than 120 million people. As the U.S. population grows and the WUI expands into areas with strong fire histories, property loss from wildfire is expected to increase. Prior to 2017, the top 10 costliest U.S. wildfires in terms of insured losses occurred in California, Tennessee, Texas, and Colorado (Table 1).
| Fire Name, Location | Date | Estimated Insured Loss (USD millions)* |
|---|---|---|
|
*Trended to 2016 dollars. |
||
| Oakland Hills Fire, CA | October 1991 | 2,746 |
| Witch Fire, CA | October 2007 | 1,488 |
| Cedar Fire, CA | October 2003 | 1,362 |
| Old Fire, CA | October 2003 | 1,253 |
| Great Smoky Mountains Fire, TN | November 2016 | 938 |
| Valley Fire, CA | September 2015 | 933 |
| Topanga Fire, CA | November 1993 | 578 |
| Bastrop County Complex Fire, TX | September 2011 | 572 |
| Laguna Canyon Fire, CA | October 1993 | 540 |
| Waldo Canyon Fire, CO | June 2012 | 477 |
The 2017 U.S. wildfire season demonstrated the catastrophic potential of wildfire in the WUI, as three fires in 2017 ended up on the list of the top 10 most destructive in California history, and two—the Tubbs and Thomas fires—broke records (Table 2).
| Fire Name (Cause) | Date | County | Structures* |
|---|---|---|---|
|
*Structures include homes, commercial properties, and outbuildings (barns, garages, sheds, etc.) destroyed. |
|||
| Tubbs (Under Investigation) | October 2017 | Sonoma | 5,643 |
| Tunnel – Oakland Hills (Rekindle) | October 1991 | Alameda | 2,900 |
| Cedar (Human Related) | October 2003 | San Diego | 2,820 |
| Valley (Electrical) | September 1995 | Lake, Napa, Sonoma | 1,955 |
| Witch (Power Lines) | October 2007 | San Diego | 1,650 |
| Nuns (Under Investigation) | October 2017 | Sonoma | 1,355 |
| Thomas (Under investigation) | December 2017 | Ventura & Santa Barbara | 1,063** |
| Old (Human Related) | October 2003 | San Bernardino | 1,003 |
| Jones (Undetermined) | October 1999 | Shasta | 954 |
| Butte (Power Lines) | September 2015 | Amador & Calaveras | 921 |
 Tammy Viggato
 Philip Camp
Edited by Rachel Wisch, CEEM
The article:
• The 2017 wildfire season caused billions of dollars in insured losses in the expanding wildland-urban interface (WUI), the high-risk area where development meets undeveloped lands
• AIR’s physically based U.S. wildfire model realistically captures the spread of wildfire and uses an ecoprovince approach that accounts for the complex and varying relationships between weather, fuels, and wildfire activity
• The spread module captures fire branding/spotting—the primary way that fire moves through urban areas, as the Tubbs Fire did
• The new Wildfire Model for the United States, anticipated for release in summer 2018, will help companies better manage this growing risk
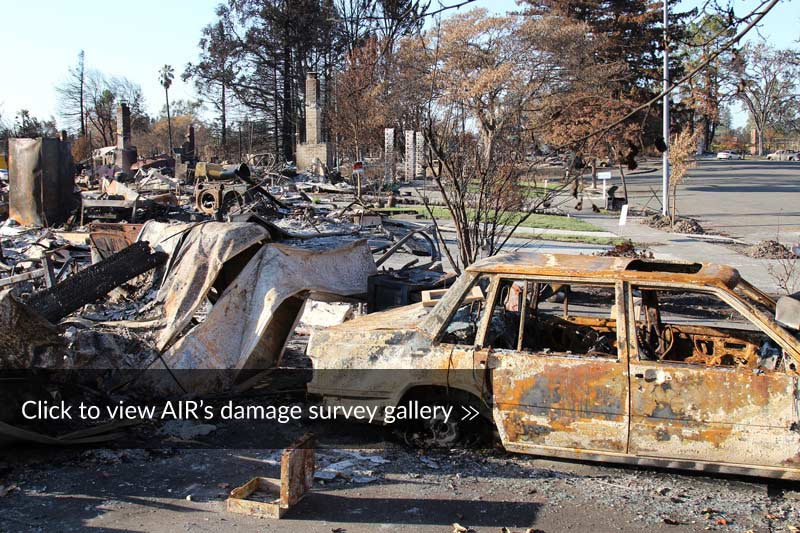
The Tubbs Fire in Sonoma County—one of 14 wildfires that scorched Northern California in October 2017—was the most destructive in state history in terms of number of homes destroyed. In December 2017, the Thomas Fire in Ventura and Santa Barbara counties grew to become the largest fire in California history—at more than 281,000 acres—surpassing the previous record set by the Cedar Fire in October 2003. And California wasn’t the only place feeling the heat; the 2017 wildfire season wreaked havoc across the western U.S., impacting Washington, Oregon, Idaho, and Montana.
To help companies effectively assess and manage this risk, AIR has developed a new Wildfire Model for the United States, anticipated for release in summer 2018.
A New Approach to Modeling Wildfire
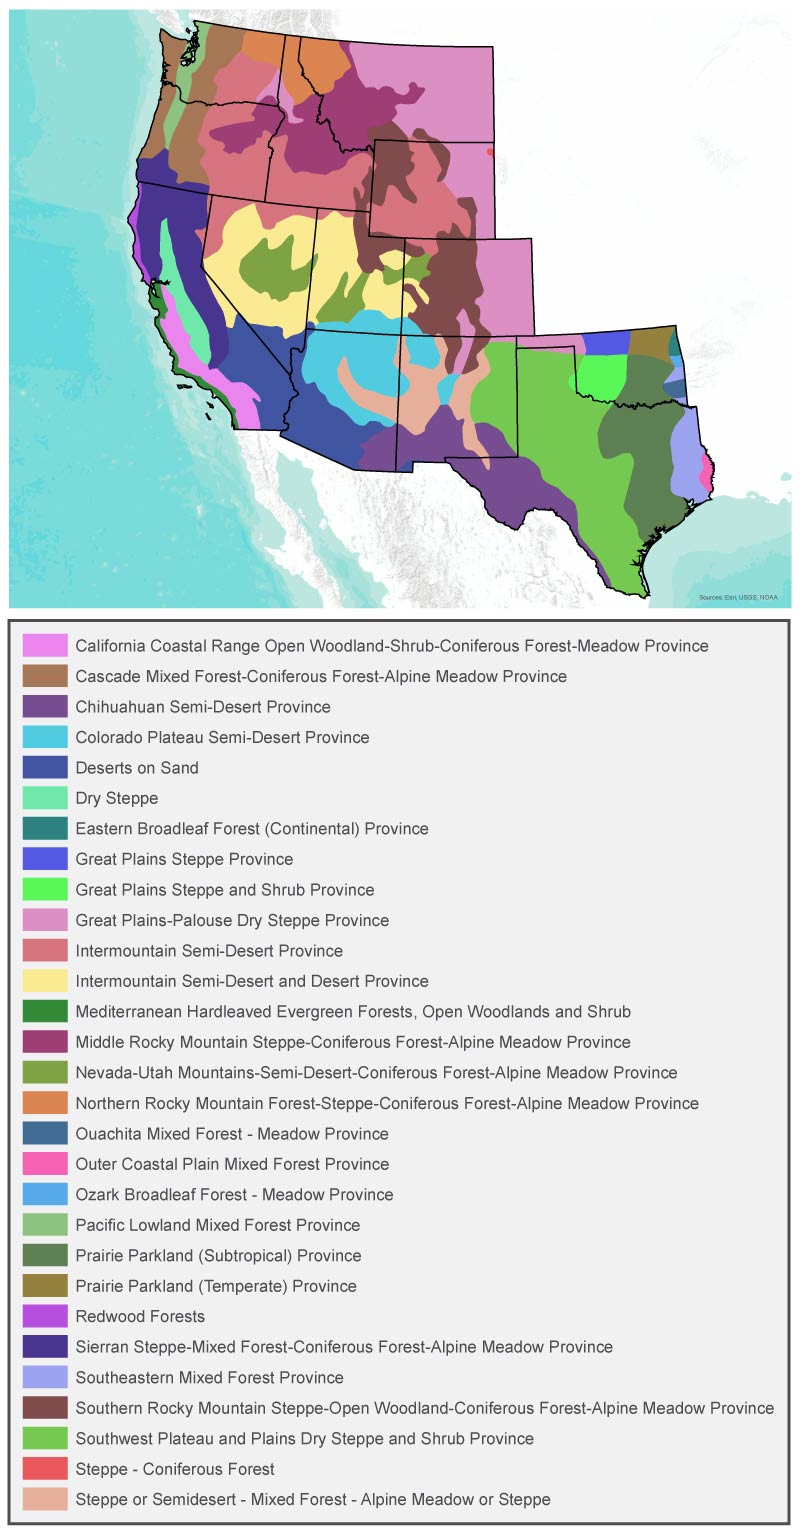
AIR’s new U.S. wildfire model captures wildfire risk in the 13 western U.S. states in which most significant loss-causing wildfires have historically occurred, enabling contiguous modeling of wildfire activity across state boundaries. Our new modeling approach builds on research showing that climate and weather are some of the major influences affecting annual area burned in the U.S.—particularly relationships between temperature, precipitation, and drought. However, the relationship between weather and wildfire is not constant and varies across large areas. To preserve the complex and varying relationships among different regions of the country, the model captures wildfire activity at the ecoprovince level—areas with similar vegetation, topography, and weather as defined by the U.S. Forest Service—to accurately reflect these spatial variations and calculate annual area burned. Of the 35 ecoprovinces AIR has mapped for the 48 contiguous United States, there are 29 in the 13 western states we are releasing this year (Figure 1).
The Ecoprovince Approach to Building the Stochastic Wildfire Catalog
The ecoprovince approach captures the complex relationship between weather and wildfire activity that varies throughout the U.S. For example, the 2017 California wildfire season was so active partially due to increased precipitation at the start of the year that triggered the growth of “fine fuels,” that is, grasses and shrubs.
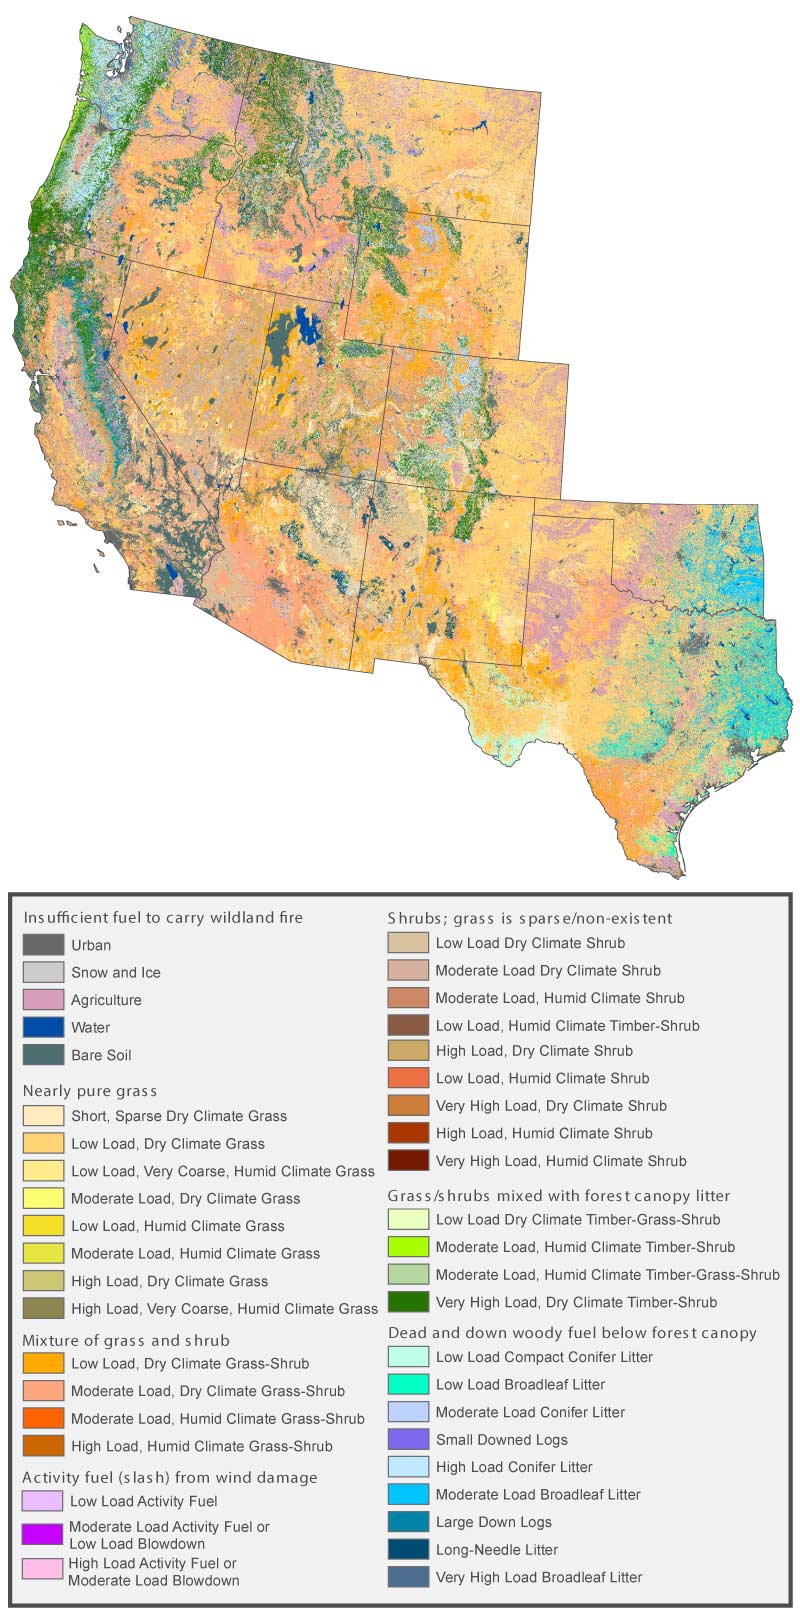
As seasons shift from wet to dry and vegetation goes through stages of growth, wildfire risk can increase or decrease. Accordingly, seasonality is considered in the frequency and size of modeled wildfires. Developed using the most current LANDFIRE data, the model’s fuels layer considers the density of surface fuel and its current condition (live or dead), type, and size class for more than 40 categories of fuel—such as grass, shrub, timber, etc.) to determine fire ignition location (Figure 2).
Physically Based Model Captures Realistic Wildfire Behavior and Spread
To capture realistically how wildfires spread across a landscape from a given ignition point, the AIR model’s physically based spread module considers wind speed, direction, slope, fuel, and topography, each of which can directly impact fire propagation and intensity. Wind speed and direction can change quickly and make fires difficult to control, so they are modeled as a time series to account for changes every three hours. Moisture is also a key factor in the spread of wildfires; for example, live vegetation has more moisture and is less likely to burn than dead vegetation, which is typically dry and burns very easily. The model accounts for these two types of fuel moisture—live and dead—to accurately reflect potential wildfire behavior.
Wildfire Spread To and Through Urban Settings
All the ways a fire can spread are explicitly accounted for in the spread module, including surface spread, surface-to-canopy (ground-to-tree) transition, canopy (tree-to-tree) spread, and fire branding/spotting (when wind-borne embers land on roofs and set structures on fire, for example); this last is the primary way fire moves through urban areas. The module realistically captures fire spread into urban areas by considering impervious surface area (such as paved roads), which is used as a measure of urbanicity. At the same time suppression efforts also impact wildfire behavior and tend to occur at a larger scale in areas of high population density. The model uses population to gauge suppression resources and account for areas where fire suppression is likely to occur. (Look for our upcoming blog on the vulnerability of structures to wildfire.)
Managing Your U.S. Wildfire Risk
As the population continues to grow, and development intersects with undeveloped lands in the WUI, more exposures will be in close proximity to fuels. (Re)insurers, underwriters, and governments cannot depend on previous experience to assess, manage, and mitigate wildfire risk. The new AIR Wildfire Model for the United States answers the call for advanced risk management tools by introducing the industry’s most comprehensive wildfire model for the western United States—the region most frequently impacted by wildfire. Our novel physically based approach to modeling wildfire can help companies better understand their risk and make more informed underwriting and pricing decisions; develop more effective portfolio management and risk financing strategies; and increase wildfire resilience.
