India Earthquake Megadisaster: Are You Prepared?
Jan 26, 2017
Event: Magnitude 5.7 earthquake
Model: AIR Earthquake Model for India
Stochastic Event ID: 580207992
Epicenter: 76.944°E, 28.735°N; approximately 2 km (1.2 miles) west of North West Delhi district
Epicenter Depth: 3.2 km (2 miles)
Affected Areas: Delhi, Haryana, Uttar Pradesh
Estimated Insured Loss: USD 2 billion (INR 13.5 thousand crores)
Annual Exceedance Probability: ~1% (100-year return period)
Event Overview
A moderate 5.7 magnitude earthquake strikes Northern India, its epicenter located in the Jhajjar district of Haryana, not more than 2 km west of Delhi. The earthquake occurs at a shallow depth of just 3.2 km; it causes widespread destruction across the districts of Delhi, Haryana, and Uttar Pradesh.
The region is referred to as the National Capital Region (NCR) of India, which comprises Delhi state and urban areas of three states around it; NCR consists of 31 districts. Delhi is the state in the center, and some districts that are part of Haryana, Uttar Pradesh, and Rajasthan combine to form NCR (Figure 1). Delhi state is also called the National Capital Territory (NCT) Delhi. For the purposes of this article, we will refer to Delhi, rather than Delhi state or NCT Delhi.
Delhi has grown both economically as well as geographically through urban settlements, and is second in GDP after Mumbai. As a result of this event, the large industrial facilities in Delhi, Ghaziabad, Gautam Buddha Nagar, and Gurgaon—including a thermal power plant and manufacturing plants—experience the loss of power and other utilities. The intense shaking damages walls and overturns shelves and storage units; some assembly lines are shut down. Roads, bridges, and other infrastructure are disrupted across the NCR. Throughout the area, there are collapsed or cracked walls, broken windows, roads made impassable by large cracks, and fallen telephone poles. AIR estimates that if such an event were actually to happen today, insured losses would amount to INR 13.5 thousand crores (USD 2 billion).
Figure 2 shows the pattern of peak ground acceleration (PGA) emanating from the earthquake’s epicenter in this AIR scenario.
National Capital Region’s (NCR’s) Tectonic Setting and Earthquake History
The earthquake in this megadisaster scenario results from background seismicity and occurs very close to the capital. But Delhi is at considerable risk even from distant earthquakes. In particular, the north-northeastward movement of the Indian Plate and its collision with the Eurasian Plate has produced many large earthquakes in the Himalayan region. The Indian Plate moves at the rate of about 4 cm (1.57 inches) per year. Since 1500, different segments of the Himalayan fault system have ruptured, causing very strong and extremely damaging earthquakes locally, with six M7.5 and greater earthquakes occurring in the past 120 years. The first of these was the 1897 M8.0 Shillong earthquake, followed by the 1905 M7.9 Kangra, 1934 M8.0 Bihar-Nepal, 1950 M8.6 Assam-Tibet, 2005 M7.6 Kashmir, and 2015 M7.8 Gorkha earthquakes. Of particular note is the 1905 M7.9 Kangra earthquake, which is the largest on record to have struck Himachal Pradesh and remains one of the deadliest in India’s history. If a very large earthquake of M8.5 or greater were to occur in the Himalayan fault system, NCR would incur heavy losses, as many buildings are highly vulnerable.
Apart from Himalayan earthquakes, NCR’s seismic hazard is also attributed to faults nearer to Delhi such as the Great Boundary Fault. Thus despite the fact that NCR lies in the intraplate stable region, it is considered to have the highest seismic risk of any Indian region of its size—at risk from both near-fault moderate earthquakes and large, distant Himalayan earthquakes.
Historically, the region has been struck by small to moderate events of magnitudes ranging between 5.0 and 6.5, and at mostly shallow depths, ranging from 5 to 20 km. However, the 1803 M7.4 Garhwal Earthquake—whose epicenter was about 150 to 200 km from Delhi—caused severe damage to Delhi. In addition, Delhi has been affected by earthquakes in the peninsular domain, such as the 1956 M6.7 Bulandshahr and the 1960 M5.6 Gurgaon earthquakes. The latter, whose intensity did not exceed VIII, affected a number of old masonry buildings, and some of the fairly strong and reinforced concrete buildings also developed minor cracks; an estimated 100 people sustained minor injuries and two died. The 1956 event was one of the strongest earthquakes to strike Uttar Pradesh, killing more than 20 people in Bulandshahr and causing numerous injuries and some damage in Delhi 68 km (42 miles) away.
Affected Exposure
The NCR is the region most heavily impacted by this Megadisaster scenario. This M5.7 event affects all nine districts of Delhi, seven districts of Haryana, and three districts of Uttar Pradesh. The overall distribution of insurable exposures in the NCR by construction types and lines of business is shown in Figure 3.
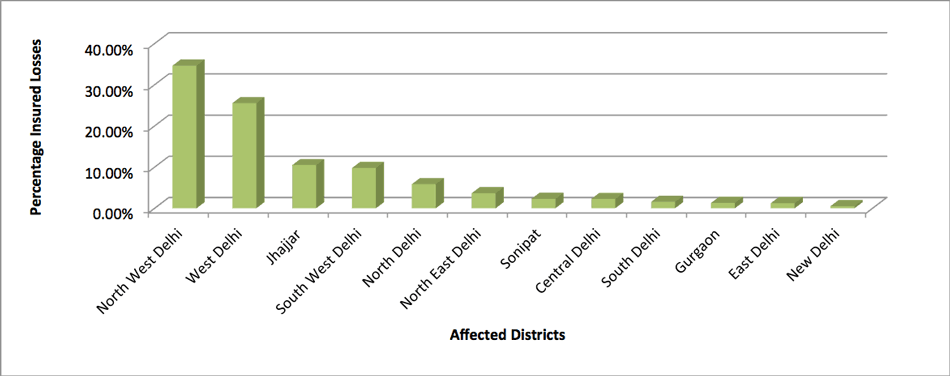
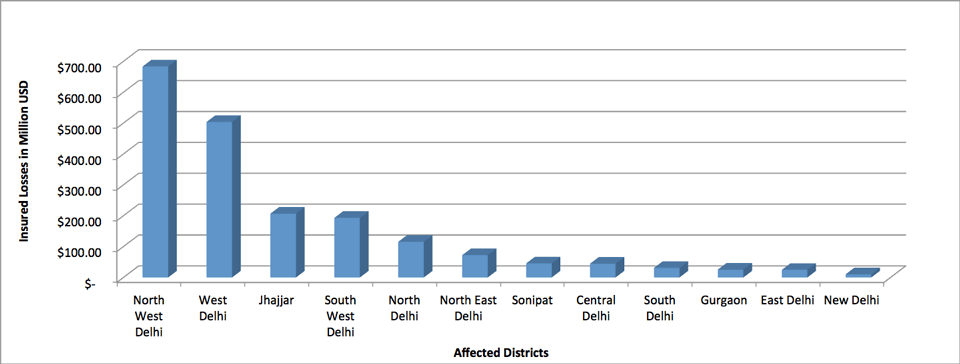
The five districts incurring the highest insured loss are North West Delhi, West Delhi, South West Delhi, North Delhi, and North East Delhi, which have a combined population of nearly 12 million.
Across all occupancies, most of the buildings in the NCR—which includes Delhi—are load-bearing rubble stone masonry, with more recent buildings constructed of brick or concrete block masonry. Steel or light metal are the construction type for nearly 50% of industrial buildings.
Residential buildings are typically of masonry or concrete construction and, given the fact that residential construction is usually non-engineered, they are more vulnerable to strong ground motion. Commercial buildings are less vulnerable than residential structures but can exhibit widespread roof and wall damage, which also lead to non-serviceability of the building and to business interruption. Residential buildings and older commercial structures will be the most heavily impacted in this scenario, incurring ceiling, wall, and veranda collapses, damaged façades, and extensive cracking. Because of the lack of seismic considerations, many of these buildings collapse during earthquakes, leading to significant casualties. The latest seismic design code in India was released in 2002; however, it is not strictly enforced, so many buildings are not up to code.
Estimating The Impact
AIR estimates that insured losses from this event would be on the order of USD 2 billion—corresponding to a 1% exceedance probability. Delhi suffers the majority of losses (85.1%)—with Haryana and Uttar Pradesh representing a distant second (14.5%) and third (0.4%), respectively.
Five districts in Delhi state—North West Delhi, West Delhi, South West Delhi, North Delhi, and North East Delhi—are hardest hit. The Central Business District—namely Connaught Place—numerous district centres, and tall residential buildings (25 stories or higher) are very vulnerable due to the vertical as well as plan configurations. The walled city area, the trans-Yamuna area, and scattered pockets of unplanned settlements are highly vulnerable due to their substandard structures and high densities. Some areas have pockets of high-rise buildings and other structures that are poorly designed or were built without specific consideration of earthquake resistance. Multi-storied apartments with basements or parking on the ground floor or second floor, for example, can experience building collapse due to “soft-story” effects. Ground motion causes damage mainly to roofs, columns, and doors.
Moreover, as Delhi is situated on the banks of the Yamuna River, the soft, deep alluvial soil amplifies the ground motion. The high-rise buildings in Gurgaon, Faridabad, Gautam Buddha Nagar, and Ghaziabad, which are far from the epicenter, are affected by low-frequency, long period seismic waves. Tall buildings have lower natural frequencies and when ground motion is dominated by low-frequency waves, which can travel great distances, the ground motion and building resonate, leading to greater building displacement and therefore damage. The distribution of loss by district shows that North West Delhi district would incur more than 30% of insured losses (Figure 5).


Are You Prepared?
Using model scenarios to probe the strengths and weaknesses of a company’s portfolio is a responsible risk management practice. It is important to prepare for a wide range of scenarios to respond effectively when disaster strikes. The scenarios that we have discussed in this article are examples of the extensive and widespread damage an earthquake could produce in India, especially in major cities near the highly active Himalayan region. The insured loss for this event has a modeled annual exceedance probability of about 1%. This is not an extreme tail event; far greater losses are possible.
A few modeling best practices can help ensure that your model produces the most realistic loss estimates:
- As the effects due to earthquake ground motion are highly localized, the accuracy of exposure data is of utmost importance. The building location relative to the earthquake’s epicenter and soil on which the building rests determine the level of ground motion to which the building would be subjected. A building’s primary characteristics, such as construction type, occupancy, and building age and height, greatly modify its responses to a given ground motion level. Hence collection of detailed information about the properties that make up your portfolio and their true replacement value helps better estimate insured losses. Consider the potential for business interruption losses. Clients can use the AIR model to calculate business interruption as a function of downtime, the level of damage sustained, the size of the building, and its architectural complexity.
- Be aware of potential losses from non-modeled sources such as landslides, fire following, tsunami, or hazardous material leakage and associated cleanup costs.
- Be aware that insurance policies differ from state to state and some perils are not covered in all states; appropriate peril filtering will significantly decrease the risk to your portfolio.
- Finally, consider your loss ratio, or how your estimated losses compare to the "total insured value" in each affected area. While your losses may at first appear to be high, the loss ratio they reflect (even in the most severely affected region of this Megadisaster analysis, the loss ratio is less than 2%) should be entirely consistent with an infrequent but thoroughly plausible catastrophic event.
Closing Comments
What will be the next megadisaster surprise?
AIR models capture the behavior of physical phenomena and how those phenomena impact the built environment. They have been thoroughly validated using data from a wide variety of sources.
But no model can predict what the next megadisaster will actually be or when it will occur. The fundamental uncertainty makes it all the more important for companies to use catastrophe models to prepare for such losses. The full range of scenarios the models generate—simulating so many perils that impact so many places—provide a unique and important global perspective on an organization's overall risk. The careful analysis of model results can help risk managers prepare for many contingencies—thus ensuring that scenarios like the one presented here will not be entirely unexpected.

