


Preview of the 2016 Atlantic Hurricane Season
Jun 20, 2016
Editor's Note: Although the 2016 Atlantic hurricane season officially began on June 1, there have already been three named storms, including one hurricane. An early start, seasonal forecasts of above-normal tropical cyclone activity, and a predicted La Niña may lead some to believe that we are in for a busy season; however, a number of factors that contribute to the inherent uncertainty of seasonal forecasts can impact how this season actually plays out.
Although the 2016 Atlantic hurricane season officially began on June 1, there have already been three named storms. Hurricane Alex formed so early in January that it might just as easily have been the 13th named storm of 2015 rather than the first of 2016; Tropical Storm Bonnie formed just off the Carolinas and caused heavy rains during Memorial Day weekend; and Tropical Storm Colin crossed Florida during the first week of June. Despite the three named storms we’ve already seen, which include one hurricane and two U.S. landfalls, early starts are not always indicative of busy seasons. A number of factors can affect outcomes.
El Niño and La Niña
Last season was characterized by both below-normal basin and landfall activity in the Atlantic and record-breaking high activity across the Eastern and Central Pacific, thanks to a full-blown El Niño—a phenomenon that occurs every two to seven years during which warm water in the western tropical Pacific extends eastward to South America. The impact of El Niño—increased vertical wind shear over the Atlantic main development region (MDR), which is detrimental to hurricane formation—is opposite to that of this season’s anticipated La Niña, which is expected to create a favorable environment for Atlantic hurricane formation. However, it is still too early to say whether a strong La Niña will actually develop.
El Niño and La Niña events are defined by the Oceanic Niño Index (ONI), which quantifies the magnitude of the sea surface temperature (SST) anomaly over the equatorial Central and Eastern Pacific—known as the Niño 3.4 region (Figure 1).
Positive ONI values greater than 0.5°C typically indicate El Niño events, whereas values less than -0.5°C indicate La Niña events. Very strong El Niños occurred in 1972–73, 1982–83, 1997–98, and 2015–16, during which the ONI exceeded 2.0°C at times. In these first three El Niño events, the transition to La Niña was steady and strong, reaching values near or below -1.0°C by the end of the year. The transition to La Niña was typically followed by higher tropical cyclone activity in the Atlantic.
The same pattern can be seen even if we consider three other paired years in which the El Niño portion was not very strong and was followed by a transition to a moderate-to-strong La Niña; the La Niña phase usually exhibited more activity in the North Atlantic.
Table 1 shows the tropical cyclone activity and ONI for these six pairs of historical years in the North Atlantic basin. Pairings in green indicate an increase in tropical cyclone activity as conditions transitioned from El Niño to La Niña, which has occurred only two-thirds of the time since 1951. Pairings in white indicate a decrease in activity or little change as conditions transitioned from El Niño to La Niña, and reveal a lesser change in ONI for those pairings.
 Dr. Peter Sousounis
AVP, Director of Meteorology
Edited by Rachel Wisch, CCM
The article:
- Forecasts are predicting above-normal hurricane activity for the Atlantic basin based on a predicted La Niña and other climate signals
- While there are indications of a continued progression toward La Niña, it is too early to know the significance of the event and its potential impact on tropical cyclone activity
- Seasonal outcomes do not always correlate with climate signals, and certain factors can greatly influence tropical cyclone activity even after the season has started
- Few forecasters attempt predictions of hurricane landfalls due to the lack of correlation between basin activity and landfall activity
| Year | Number of Named Storms | Number of Hurricanes | Number of Major Hurricanes | Peak ONI | Δ ONI (La Niña Years) | ||
|---|---|---|---|---|---|---|---|
| { | 1963 | 9 | 7 | 2 | 1.2 | ||
| 1964 | 12 | 6 | 6 | -0.8 | -1.6 | ||
| { | 1969 | 17 | 12 | 5 | 0.8 | ||
| 1970 | 9 | 5 | 2 | -1.2 | -0.5 | ||
| { | 1972 | 4 | 3 | 0 | 2.0 | ||
| 1973 | 7 | 4 | 1 | -1.9 | -2.1 | ||
| { | 1982 | 5 | 2 | 1 | 2.1 | ||
| 1983 | 4 | 3 | 1 | -0.8 | -1.1 | ||
| { | 1987 | 6 | 3 | 1 | 1.6 | ||
| 1988 | 10 | 5 | 3 | -1.8 | -1.6 | ||
| { | 1997 | 7 | 3 | 1 | 2.3 | ||
| 1998 | 14 | 10 | 3 | -1.4 | -1.6 | ||
This year, the March–May ONI was 1.1°C, a decrease from a peak of 2.2°C in December–February.1 Most recently, the ONI value on June 1 was -0.1°C,2 indicating a continued progression toward La Niña conditions. However, it may not be until the end of June—when a critical point is reached in the expected La Niña evolution—that the significance of this event’s impact on tropical cyclone activity will be known.
Atlantic Multidecadal Oscillation
Another significant climate signal, the Atlantic Multidecadal Oscillation (AMO), should also be examined when considering the Atlantic hurricane season. A mode of variability in the North Atlantic Ocean that influences water temperatures over a timescale of multiple decades, the AMO is classified in phases. Positive AMO phases, such as those seen from 1878–1899, 1926–1969, and since 1995 (Figure 2), are characterized by above-average tropical and far North Atlantic SSTs, below-average tropical Atlantic sea level pressures (SLPs), and reduced levels of tropical Atlantic vertical wind shear—conditions known to create a more favorable environment for Atlantic hurricane formation and intensification.
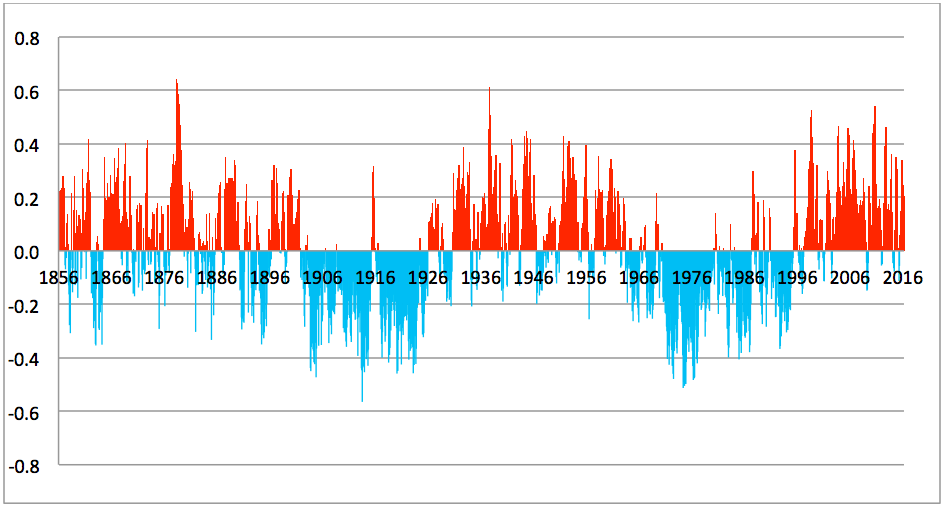
Recently, the AMO has been decreasing (Figure 2). Since 2012, SSTs in the tropical and far North Atlantic have been lower on average and SLPs throughout most of the Atlantic have increased, creating conditions associated with a weaker thermohaline circulation akin to those seen in negative AMO phases such as 1900–1925 and 1970–1994. A closer look at the indexes reveals many instances when the AMO has been negative for a short time before returning to positive, and a review of the historical record shows that the AMO has gotten a slight positive boost every time the atmosphere-ocean system transitioned to La Niña, even when it had been negative. If that happens again this year, it is more likely that the AMO will remain positive and Atlantic SSTs may be slightly higher than they were last year. Coupled with lower vertical wind shear from a developing La Niña, these conditions provide a more favorable environment for tropical cyclone genesis over the MDR of the North Atlantic.
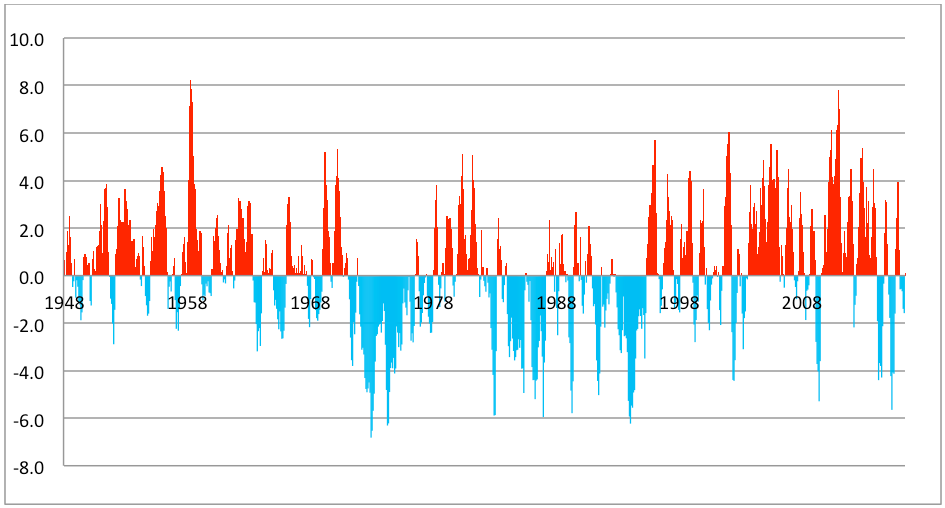
Atlantic Meridional Mode
The Atlantic Meridional Mode (AMM), a north-south dipole of temperature anomalies in the tropical Atlantic Ocean,3 has also been shown to significantly influence Atlantic hurricane activity. A recent study showed that strong La Niña events and concurrent positive AMM phases—during which SSTs trend warmer, and vertical wind shear is weaker over the tropical North Atlantic—work together to sustain extremely active Atlantic hurricane seasons.4 The AMM, however, changes sign quite a bit throughout the year. It is currently negative (Figure 3), which inhibits hurricane formation, but has rarely remained negative through the heart of the hurricane season. It stayed negative in 1992, which may have contributed to below-average seasonal activity that year along with a negative AMO, although this was also the year of record-breaking Hurricane Andrew.
Forecasts for the 2016 Atlantic Hurricane Season
The various forecasting agencies take some or all of the factors mentioned into account (as well as others) to derive their seasonal forecasts (Table 2); projections range from 10–18 named storms, including Alex, Bonnie, and Colin. Some of the lower projections may be influenced by the recent AMO trend and current AMM phase. The historical record suggests we will know more about La Niña in just a couple of weeks, at which point forecasts are likely to be more reliable.
| Agency | Forecast Date | Named Storms | Hurricanes | Major Hurricanes |
|---|---|---|---|---|
| *Based on Atlantic seasonal means from 1981–2010. (Source: NOAA) | ||||
| Colorado State University | June 1 | 14 | 6 | 2 |
| WeatherTiger | June 1 | 14 | 9 | 3 |
| NOAA | May 27 | 10–16 | 4–8 | 1–4 |
| Tropical Storm Risk | May 27 | 17 (±4) | 9 (±3) | 4 (±2) |
| UK Met Office | May 12 | 14 | 8 | -- |
| Coastal Carolina University | April 28 | 13 | 7 | 3 |
| Weather Channel | April 22 | 14 | 8 | 3 |
| North Carolina State University | April 15 | 15–18 | 8–11 | 3–5 |
| AccuWeather | April 9 | 14 | 8 | 4 |
| Consensus | 14 | 8 | 3 | |
| Historical Averages for Near-Normal Seasons* | 12.3 | 6.3 | 2.3 | |
The forecasts in Table 2 are of general tropical cyclone activity. Landfall activity is a much lesser known quantity, and, therefore, much more difficult to project. It is important to highlight the lack of correlation between basin activity and landfall activity. The complexity of this relationship was demonstrated in 1992. While only six named storms formed, one of them was Category 5 Hurricane Andrew, which devastated southern Florida and is one of the most destructive landfalling hurricanes in U.S. history. A similar scenario unfolded in 1983, which had only four named storms; however one of them was Category 3 Hurricane Alicia, which hit the Houston-Galveston area and caused almost as many direct fatalities as Andrew. At the other end of the spectrum, 2010 had 19 named storms and 12 hurricanes, but not a single U.S. landfall. As has been noted in previous hurricane preview articles, the factors that control the specific storm tracks, such as the North Atlantic Oscillation (NAO), change almost capriciously several times within a season and are therefore still unreliable predictors on seasonal scales.
Inherent Uncertainty and Managing Your Risk
Although AMO, ONI, and AMM provide some insight, there is more to forecasting seasonal hurricane activity. Many other factors are at play, including the Quasi-Biennial Oscillation (QBO), Sahelian drought, Saharan dust, tropical mid-level moisture, easterly waves, and other SST anomalies over other portions of the basin, to name a few. In addition, the Madden Julian Oscillation—a disturbance of clouds, rain, winds, and pressure that moves eastward and returns to its starting point every 30–60 days—is the greatest element of intraseasonal variability and can give several boosts within a season.
Coupled with the unpredictability of landfall activity, the various climate signals that influence storm formation highlight the inherent uncertainty in seasonal hurricane forecasts. While we may know how La Niña will affect hurricane activity by the end of June, we will have to wait until the season’s end to find out whether the counts stayed within the vague lines drawn by the forecasts, and more importantly, if any hurricanes that develop actually make landfall.
