


An End to the Drought: Recap of the 2016 Hurricane Season
Dec 20, 2016
Editor's Note: The 2016 hurricane season finally saw the end of Florida’s much talked about hurricane drought with the arrival of Hurricane Hermine on September 2. Overall, the 2016 season was much more active than last year’s in the Atlantic Basin and has already seen above-normal activity in the Eastern and Central Pacific basins. In this article, AIR Assistant Vice President and Director of Meteorology Dr. Peter Sousounis discusses some of this year’s notable Atlantic (and Pacific) storms and reviews forecasts for the current 2016–17 Southern Hemisphere tropical cyclone season.
The Atlantic Basin
The Atlantic Basin spawns 11 named storms in an average year, six of which become hurricanes, including three that achieve major (Category 3 or higher) status. In numbers, the 2016 Atlantic hurricane season was close to this average with 15 named storms, of which seven reached hurricane strength and three became major hurricanes (Gaston, Matthew, and Nicole). But when considering losses, it was the most active and costliest since 2012.
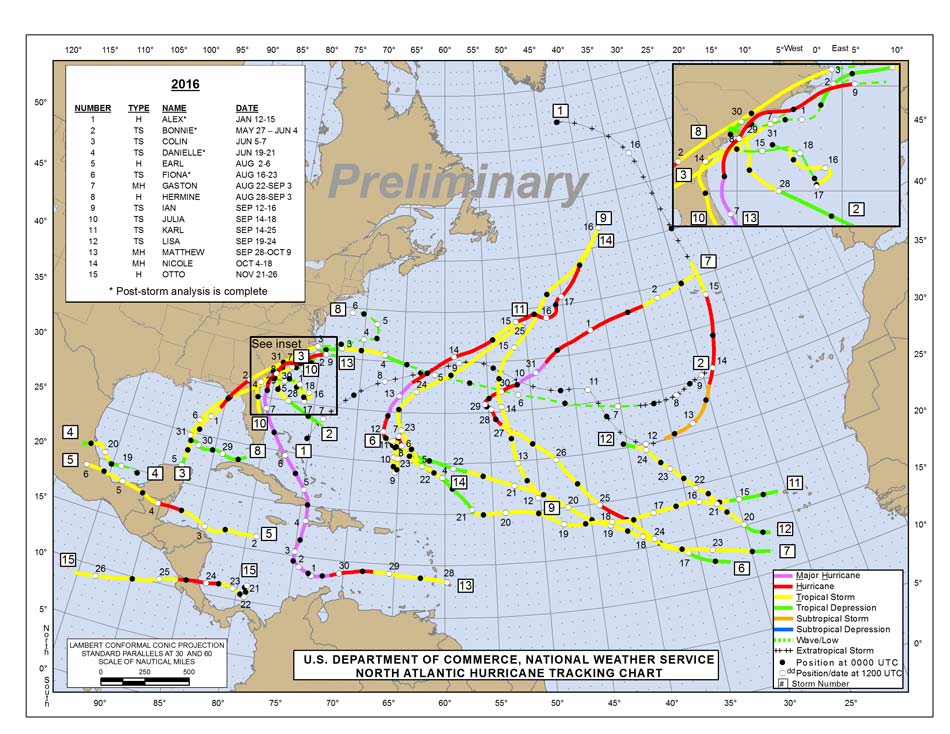
The Atlantic hurricane season officially begins on June 1 and runs through November 30. Storms, however, can—and sometimes do—occur earlier and later in the year. On average a hurricane forms in December once every 10 years; the frequency is the same for May storms, but on rarer occasions they form even earlier. Notably, the first hurricane of 2016, Alex, formed in mid-January. Only three other tropical or subtropical storms are known to have formed this early since 1851, and only one other hurricane is known to have formed in January (in 1938).
Hurricane Drought
One of the main features of Atlantic hurricane seasons in recent years has been the absence of major (Category 3 or higher) storms making landfall on the U.S. Gulf Coast or East Coast and any hurricanes at all making landfall in Florida. These seasons were not necessarily inactive ones; rather, they were simply years in which only Category 1 or Category 2 storms made landfall in the United States, none of which struck Florida. The number of Atlantic storms that formed was close to normal each year.
According to the National Hurricane Center, about 40% of landfalling U.S. hurricanes from 1851 to 2010 made landfall somewhere along Florida’s 1,260 miles of coast. But since Wilma came ashore in south Florida in October 2005, not one of the subsequent 68 Atlantic hurricanes made landfall in the state. Upper-atmospheric steering currents pushed hurricanes such as Ike (2008), Irene (2011), Isaac (2012), and Arthur (2014) to one side of Florida or the other. Other tropical cyclones approaching the state weakened or dissipated before arriving as a result of dry air, wind shear, interaction with islands in the Caribbean, or a combination of these factors.
There was no one cause of Florida’s hurricane drought. It occurred simply because during the period of nearly 11 years the tracks of each successive hurricane managed to avoid the state. It should be noted, however, that between 2006 and June 2016, nine tropical storms made landfall in Florida. But no hurricane crossed its coast until Hermine made landfall near Tallahassee as a Category 1 storm on September 2, thus ending the longest Florida “hurricane drought” on record.
Because our understanding of the physical processes involved in hurricane activity is still incomplete—and because observational records are limited—catastrophe modelers take recourse in statistical modeling approaches. Florida’s hotly debated hurricane drought, although unprecedented in the brief historical record, is reproducible using AIR’s stochastic catalogs. (To learn more, see Suilou Huang’s blogs Notes on Florida's Hurricane 'Drought' and How Often Does Florida Experience a Hurricane Drought?)
Damaging Hurricanes
Hurricane Matthew affected the Caribbean and the southeastern coastline of the United States for nearly two weeks in September and early October. It reached its peak intensity as a Category 5 hurricane before passing between western Haiti and eastern Cuba, clipping both. It then moved along the eastern coast of the United States, weakening more quickly than anticipated to a minimal Category 1 as it bypassed Florida and Georgia before making landfall in South Carolina on October 8. Matthew did not devastate any one location, but it passed along the U.S. coast close enough and long enough to inflict a significant total of damage from wind, flooding rain, and storm surge. AIR’s estimated industry insured losses for the U.S. ranged from USD 2.2 billion to USD 6.8 billion. Even though it eventually made landfall, Matthew serves as a reminder that even bypassing storms can cause major damage.
The third and last major hurricane of the season, Nicole, had weakened from Category 4 to Category 3 when it tracked close enough to Bermuda to be termed a direct hit. According to the National Hurricane Center (NHC), only seven major hurricanes have passed within 40 nautical miles of Bermuda since records began in 1851. Nicole’s ring of strongest winds had shrunk from 50 to 40 miles in diameter when it moved over Bermuda, which is only 15 miles wide, causing numerous power outages but less damage than feared. This was the first October on record to have spawned two Category 4 or greater storms over the Atlantic Basin.
Table 1 shows the Accumulated Cyclone Energy (ACE) index as reported at the official end of the 2016 Atlantic hurricane season. The seasonal total, 132.43, is above the 1951–2000 seasonal average of 93 and is the highest since 2012. ACE-wise, 2016 was clearly above normal.
| Season Type | Above-Normal | Near-Normal | Below-Normal | 2016 Atlantic Hurricane Season ACE Total |
|---|---|---|---|---|
| ACE Index (104 kt2) | >111 | 66-111 | <66 | 132.43 |
 Peter Sousounis, Ph.D.
AVP, Director of Meteorology, Research
Edited by Jonathan Kinghorn, CCM
The article:
- The 2016 Atlantic hurricane season began early, ended late, and was the most active and costliest since 2012; activity in the Eastern and Central Pacific basins was also above average while the Western Pacific saw a near normal number of storms.
- Florida’s near 11-year “hurricane drought” ended, although the U.S. Gulf and East coasts’ major hurricane drought continues.
- The transition from a strong and persistent El Niño to a weak La Niña impacted wind shear and sea surface temperatures in both ocean basins, contributing to seasonal outcomes.
In Other Parts: The Eastern and Central Pacific Basins
While the biggest headline of the season may have been the end of Florida’s hurricane drought, the Pacific Basin was also newsworthy. In the Northern Hemisphere Eastern and Central Pacific Ocean basins, most tropical cyclones occur between May and October, but they can develop at any time of year.
The 2016 Eastern Pacific hurricane season began on May 15, and was definitely quieter than that of 2015, which was the busiest on record. This year saw 10 tropical cyclones active in the region, six of them becoming hurricanes, all but one of which reached major hurricane status. According to NOAA, between 1971 and 2009 the average Eastern Pacific season saw 15 named storms and eight hurricanes, of which three were major hurricanes.
Typically, four to five tropical cyclones occur in the Central Pacific Basin each year, the majority of which originate in the Eastern Pacific. After a slow start, the 2016 season became extremely busy in July with the first storm, Agatha, forming on July 2, followed rapidly by six more named storms within the month. Of these, Darby strengthened into a Category 3 and Blas and Georgette reached a strong Category 4. All seven storms traveled from Mexico´s west coast toward Hawaii, but only Darby reached the islands.
Tropical Storm Darby made landfall on the Big Island of Hawaii as a minimal tropical storm on July 23, near the location of Iselle’s landfall in 2014. As a group of small islands in a vast ocean, Hawaii is usually missed by tropical cyclones, and cooler waters and strong wind shear generally weaken any that approach it. Since recordkeeping began in 1949 no hurricane has made landfall on the Big Island and only 13 have passed within 230 miles. In September, Hawaii was impacted by two more hurricanes—Madeline and Lester—neither of which made landfall.
Further Afield: The Western Pacific Basin
The season in the Western Pacific also got off to a slow start. Nepartak—the first typhoon of the season—did not form until July 2, making this the second-latest-starting Western Pacific (WPAC) typhoon season on record. In becoming a tropical storm, Nepartak ended a record-setting 199-day period since the last storm was active within the basin. In terms of minimum central pressure, Nepartak was the second most intense tropical cyclone of the year. The system passed directly over Taiwan and dissipated after making a second landfall over Fujian Province in China.
Despite the slow start, the basin made up for lost time; there have been 25 named storms in 2016, and the year is not quite over. After the three storms in July, August saw eight storms. By the end of August, three of them— Mindulle, Lionrock, and Kompasu—had hit the Japanese island of Hokkaidō, the most since 1951. With a total of six landfalling storms and two bypassing systems this year, Japan has seen the most activity since 10 storms made landfall in 2004. China has also seen its share of activity, with eight landfalling storms and one bypasser. Of these, Super Typhoon Meranti was the most significant by far. Impressive as the activity was between July and October, no strong storms formed in the basin during November. Typically, strong storms can develop and affect the Philippines at this time of year, recent examples being Bopha (2012), Haiyan (2013), and Hagupit (2014).
What’s Ahead This Winter: The Southern Hemisphere
The 2016−17 tropical cyclone season has just begun in the Southern Hemisphere, which officially runs from November 1 to April 30. While there is a high degree of uncertainty in some elements of the models used to generate the prediction, the Australia Bureau of Meteorology (BOM) forecasts indicate an above-average number of tropical cyclones are likely for the basin as a whole and a 63% chance of above-average tropical cyclone activity in the Northwestern sub-region.1 In the southern Indian Ocean, which is also included in the Southern Hemisphere tropical cyclone season, two tropical cyclones—Abela in June and Bransby in October—formed before the season started.
Closing Thoughts
The formation of Hurricane Alex in January emphasizes that, while the official Atlantic hurricane season runs from June 1 to November 30, hurricanes can—and do—form at any time of year. Hurricane Matthew reminds us that bypassing hurricanes can also inflict significant damage if their track remains close to exposure for a protracted period. And while general tropical cyclone counts and intensities within basins may be correlated, landfall activity and insured losses may not be. For one reason or another, major hurricanes have not made landfall on the U.S. Gulf Coast or East Coast for over a decade, but that run of good luck in some respects ran out in 2016 and the Florida hurricane drought at last came to an end. We also should not forget that hurricanes do not need to be Category 3 or higher to inflict significant damage, as Hurricane Ike (2008), Hurricane Irene (2011), Hurricane Isaac (2012), Superstorm Sandy (2012), and many other storms have proven. Finally, this year’s sluggish transition from El Niño to La Niña highlighted the reality that seasonal forecasts are inherently uncertain, and that probabilistic models remain the most reliable method of obtaining a comprehensive view of tropical cyclone risk.
