


An End to 200 Days of Quiet in the Northwest Pacific
Nov 17, 2016
Editor's Note: This article discusses the unique nature of record-breaking Typhoon Nepartak, its impact at landfall, the vulnerability of Taiwan’s building stock, and the complexities of typhoon risk in Southeast Asia.
Introduction
The strongest first-typhoon-of-the-season to hit Taiwan in 50 years, Typhoon Nepartak ended the longest typhoon drought on record for the Northwest Pacific basin in July 2016, wreaking havoc and breaking records as it crossed the country.
A Late Start Fells Records
After 200 days without any named storms in the Northwest Pacific, Typhoon Nepartak kicked off the 2016 season and ended the longest typhoon drought in history for the basin when it formed on July 3. Although 95% of storms historically occur after May 1, all but four seasons since 1951 spawned their first named storm by May 31, making a first typhoon in July a very late start.1 The delay, however, was not unexpected. A review of the genesis dates of the first storms named by the Japan Meteorological Agency (JMA) since 1951 shows that in years trending from moderate-to-strong El Niños into weak-to-moderate La Niñas—like the 2016 trend—the typhoon season starts late.2
Nepartak was only the second instance of a first storm intensifying to Category 5 equivalency, the first being Typhoon Olive in 1963, which never made landfall. While tropical cyclones can reach Category 5 intensity at any time of year in the Pacific basin, the JMA record indicates such storms are usually generated in September, making Nepartak both unusually strong for a first storm and unusually early for its strength.
The Track of Typhoon Nepartak
Typhoon Nepartak made landfall in Taiwan on July 7 with a central pressure of 940 mb and JMA-estimated wind speeds of 120 mph (1-minute sustained). Many areas across Taiwan received more than 300 mm precipitation, with mountainous regions receiving record-high amounts exceeding 500 mm.3 After crossing the Central Mountain Range of Taiwan, a much weaker Nepartak made a second landfall in the coastal province of Fujian, China, on July 9. Although Nepartak then weakened rapidly, heavy precipitation reaching 250 mm in some areas led to severe flooding.4
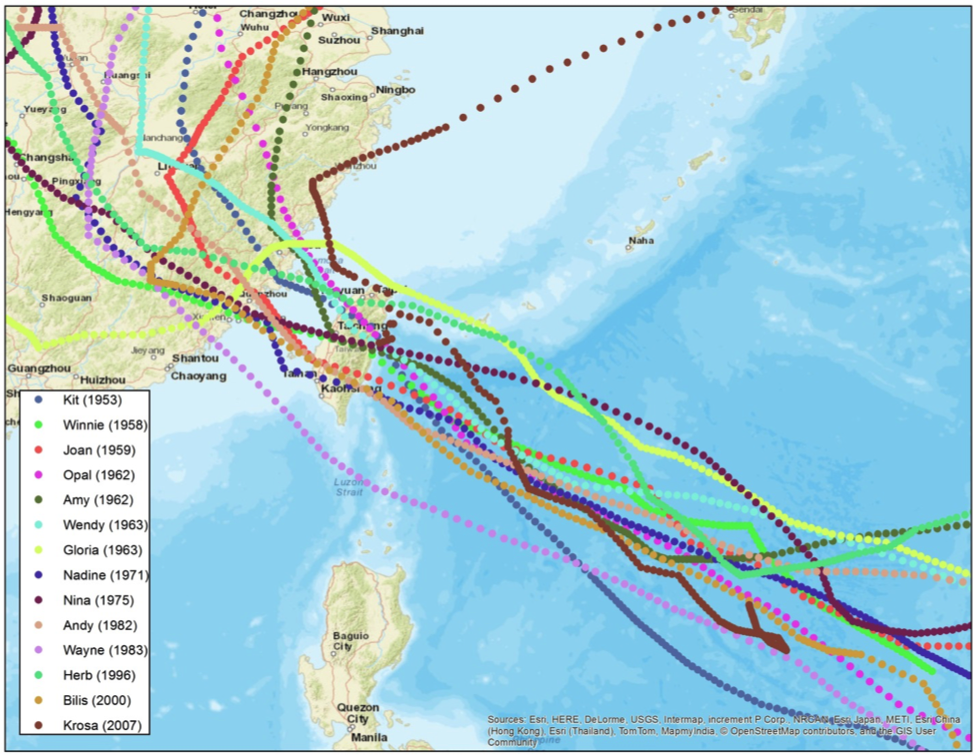
This particular storm track, impacting Taiwan first and then China, is not uncommon. An analysis of the JMA Best Track Database (1951–2014) revealed that 54 storms have made landfall in both Taiwan and China, and 14 storms had similar tracks to Nepartak in the last 64 years (Figure 1).
 Anna Treviño, Ph.D.
Senior Scientist, Research
 Jiazhen Peng, Ph.D.
Senior Engineer, Research
Edited by Rachel Wisch, CCM
A Unique Storm
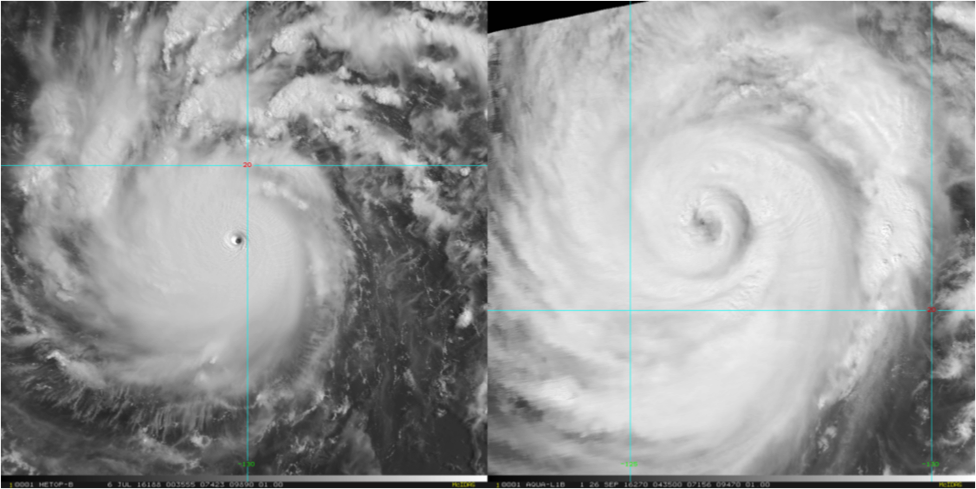
With its large and nearly symmetrical eye, little or no discernable banding, and an eyewall entirely surrounded by intense thunderstorm activity, Typhoon Nepartak’s structure was distinctive. Figure 2 compares the so-called annular, or ring-shaped, appearance of Typhoon Nepartak with that of the more common asymmetric shape exhibited by Typhoon Megi—another 2016 storm that made landfall in Taiwan—with clearly visible spiral rainbands.
Annular systems also tend to be significantly stronger, maintain their peak intensities longer, and weaken more slowly than more typical cyclones.5 Nepartak was no exception, ranking as the ninth most intense storm since 1951 by central pressure based on JMA data and Saffir-Simpson Hurricane Wind Scale classification (a convenient measure for Pacific typhoons). Typhoon Nepartak also maintained Category 5 intensity for 42 hours (with a peak intensity of 900 mb), which is more than the average of 35 hours.
Nepartak also approached Taiwan at a very fast forward speed. In the 24 hours before making landfall, Nepartak was ranked seventh fastest on record—moving at 11 mph (18 km/h)—which allowed it to pass quickly across Taiwan and likely reduced the potential for widespread damage. Most tropical cyclones in the tropics (between about 5.0°N and 23.5°N) move at an average speed of 5 mph (8 km/h); Nepartak’s average forward speed was 9 mph (15 km/h).
Reported Impacts
Pre-landfall preparations can mitigate some impacts from typhoons, most notably by the saving of lives. Before Nepartak came ashore, the government evacuated more than 17,000 people, closed all schools and businesses, and canceled more than 500 domestic and international flights, which helped keep fatalities low; however, around 300 people were injured, about 500,000 households lost power, and nearly 25,000 homes lost access to potable water. High winds and wind-borne debris caused destructive nonstructural damage to the roof and wall claddings of many structures; cars and motorcycles were reportedly overturned by wind; commercial signage and billboards were destroyed; and downed power lines and uprooted trees were widespread. Taiwan’s Central Emergency Operation Center estimated total damage at USD 21.1 million within days of the event.6
Vulnerability Considerations: The Role of Taiwan’s Mountains
The Central Mountain Range of Taiwan provides some protection from landfalling typhoons. Typhoons must cross them before reaching the more densely populated western coast and the mountains typically destroy low-level circulation and aid rapid dissipation. Building codes in Taiwan also help mitigate wind damage. Engineered buildings can better resist wind loads because building codes are designed for the high frequency of both typhoons and earthquakes in the region; still, nonstructural damage, contents damage, and business interruption are common and can lead to considerable typhoon losses.
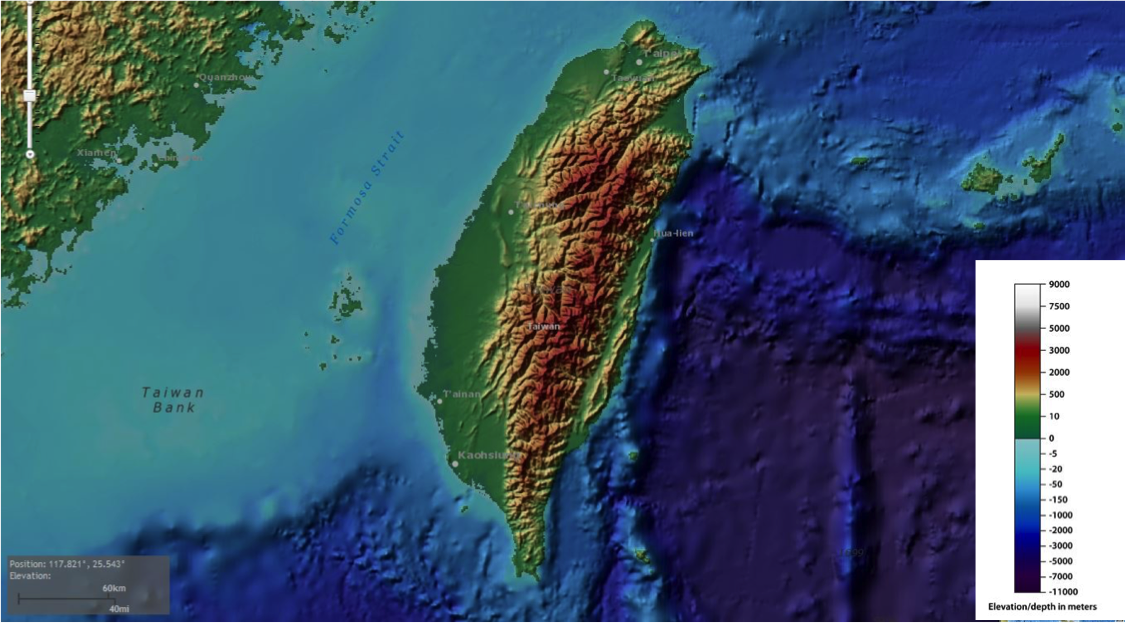
Precipitation-induced flood and storm surge can drive typhoon losses to a significant degree. For example, Typhoon Nari (2001) and Typhoon Morakot (2009) each caused billions in water damage. Taiwan has upgraded its flood defense systems (such as drainage systems and levees), especially in urban areas, including the Greater Taipei area in the northern part of the country and Kaohsiung City in the southwestern part. However, because Taiwan’s mountains serve to slow storms down, precipitation accumulates more on the western side of the range, which increases the risk of both landslides and flooding there. Moreover, the shallow bathymetry—or ocean depth—on the western coast of Taiwan (Figure 3) combined with the location of most populated cities on estuaries create an ideal environment for storm surge to cause damage, with the potential for high losses.
Infrastructure Vulnerability in Southeast Asia
As urban populations grow throughout Southeast Asia, infrastructure becomes an increasingly critical lifeline. Growing populations mean more roads; this creates more impermeable surfaces that lead to more surface water runoff during heavy precipitation, and drainage systems cannot always keep pace. Drinking water contamination is another concern, and is more serious in less developed regions where alternative water supplies may not be available. Supports for electricity transmission lines, which can perform well in water, are quite vulnerable to strong wind; the consequence of their damage or collapse is loss of power for thousands or even millions of households, as well as for the mitigation mechanisms driven by electricity, such as water pumps and floodgates.
Manage Your Risk
Since Typhoon Nepartak, the 2016 Pacific typhoon season has been anything but quiet. A significant number of typhoons have impacted the basin in quick succession; September alone saw Malakas, Megi, and Meranti, and in October Chaba, Sarika, and Haima came through. To provide companies with a comprehensive view of typhoon risk in Southeast Asia, AIR has incorporated the latest regional information and research into the new and updated Southeast Asia typhoon models released this year. A unified basinwide catalog shared by all modeled countries—including Taiwan—was developed to help global companies make seamless risk assessments for multi-country policies and portfolios. Peril-specific damage functions for wind, precipitation-induced flooding, and storm surge allow users to input policy conditions and attribute damage by sub-peril to exposures, including buildings, contents, and specialized risks (such as large industrial facilities and marine cargo). The models also include a new module for major infrastructure to help organizations better understand the vulnerabilities and impacts of typhoons on these exposures. Damage from typhoons is the most frequent cause of property loss in Southeast Asia, making proactive risk management imperative as the typhoon risk landscape in the region continues to evolve.
