


Turning the Tide on Modeling Storm Surge
Jun 24, 2015
Editor's Note: Tide height at landfall has an impact on whether tropical cyclone storm surge losses will be negligible or catastrophic. This article describes the natural forces that influence the height of tides and how tidal variation is captured in the 2015 update to the AIR U.S hurricane model to help companies better manage their risk.
In some regions of the United States, particularly in the Northeast, the difference between high and low tides can be significant. The tide height at hurricane landfall can make the difference between a storm that fades into obscurity or one that goes into the record books.
Even for storms with high surge losses, such as Hurricane Sandy, different tidal conditions—for example, at a different time of day or during a different time of the month—could have led to significantly higher losses. Tidal variation is thus an important consideration in storm surge modeling
What Drives the Ebb and Flow
Many factors affect tides, including: gravitational pull of the sun and the moon and their alignment with Earth; bathymetry, the shape of the earth below water; and topography, the shape of the earth above water.
An aligned sun, moon, and Earth amplify tidal effects, a phenomenon known as spring tides (the name refers to the word's meaning "to jump," not the season). Spring tides occur on or around a full moon or a new moon, with a new moon causing slightly higher high tides and lower low tides than a full moon. When the sun and moon, as seen from Earth, are 90 degrees from one another—either during the moon's waxing stage (when the moon is growing toward a full moon) or the moon's waning stage (when the moon is decreasing toward a new moon)—their tidal effects largely cancel each other out, causing smaller tidal ranges known as neap tides. About seven days separate spring tides from neap tides. A depiction of Earth, Sun, and moon alignment at spring and neap tides can be seen in Figure 1.
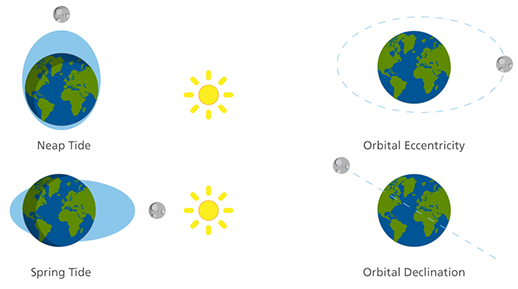
The moon has other tidal effects as well. Its distinctly elliptic orbit (known as "orbital eccentricity") brings it closer to and farther away from Earth, changing the tidal forces felt on Earth. Tides are highest when the moon is closest to Earth (perigee tide), and weakest when farthest away (apogee tide). While infrequent, a spring tide at perigee results in exceptionally high tides.
The moon's elliptic orbit affects tidal forces over the 27-day lunar month. The moon's orbit around Earth is not perfectly in line with Earth's equator; rather, it departs from the equator by about 5 degrees. This inclined orbit, in combination with the elliptic orbit, means that the moon is in the exact same position relative to Earth only once every 18.61 years—which is why tides are defined by the 19-year National Tidal Datum Epoch.
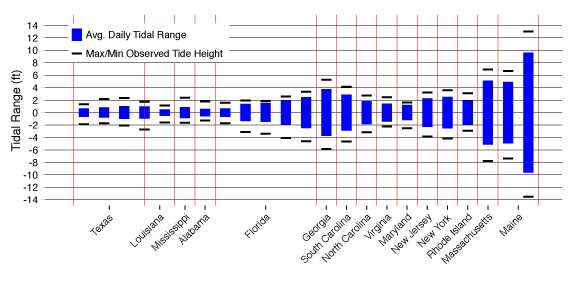
The moon's oblique orbit, along with Earth's tilted axis, explains why some areas see one high and low tide per day while others see two per day, why the two high and low tides in a day may not be equal, and why tidal variation generally increases with latitude. In our U.S. hurricane model, AIR accounts for this variation, known as diurnal inequality, by dividing the Gulf and Atlantic coasts into 62 segments of 50 nautical miles each; for each segment, an average daily tidal range is implemented, as well as an observed minimum and maximum. A sample of this range can be seen in Figure 2.
 By: Dr. Mark Hope
Scientist
Edited by Sara Gambrill
The article: - Tides can, and have, determined whether tropical cyclone losses are historic or negligible.
- Gravitational interactions between the sun, moon, and Earth drive tides, but local factors, such as bathymetry and topography, can have profound effects on tide heights.
- AIR's new tidal adjustment module, part of the new hydrodynamic storm surge model in the 2015 AIR U.S. hurricane model, accounts for all 37 NOAA-identified factors that drive tides.
Tides and Hurricane Sandy
The moon's orbit and Earth's axis explain some of the tidal range seen in Figure 2. Bathymetry and topography—the shape of the earth below and above the water, respectively—explain the rest. In certain locations the coastal geography can affect the height of high and low tides, amplifying or reducing tidal ranges. In the United States the two regions with the largest tidal ranges are in Georgia and New England—particularly Maine. Georgia tides are influenced by the length of the continental shelf, and Maine tides can be amplified in excess of 50 feet by the enclosed Bay of Fundy to the north, where the highest tides in the world can be found.
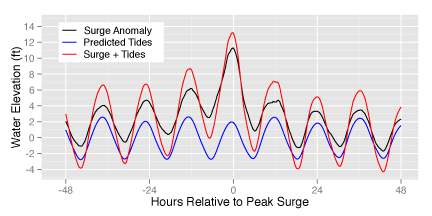
Because of the potential for dramatically different tidal conditions, the timing of tropical cyclone landfall can significantly affect storm surge elevation and ultimately losses, as illustrated by Hurricane Sandy. At about 8:00 p.m. on October 29, 2012, Hurricane Sandy made landfall north of Atlantic City, New Jersey. Landfall coincided with a high tide elevated by the gravitational pull of a full moon, or a spring tide. However, due to diurnal inequality, the high tide at Sandy's landfall was not as high as other high tides occurring at that time of year. Figure 3 depicts the predicted (tidal) water levels, the surge generated by Sandy, and the combined effects of the surge and tides. A record storm tide of 11.28 feet was recorded at the Battery in lower Manhattan. Local bathymetry and topography in the immediate area of the Battery had little effect on Sandy, but the region's coastal geography funneled floodwaters into New Jersey, Staten Island, Queens, and the Bronx. Total insured loss from Sandy exceeded USD 18 billion; storm surge accounted for much of it.
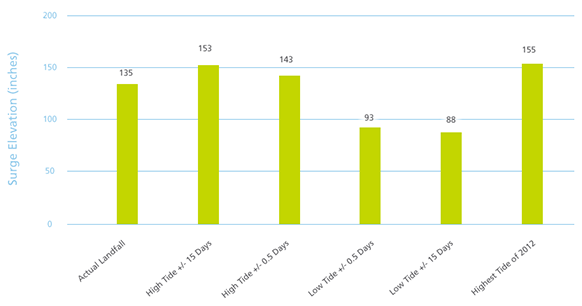
As Figure 4 shows, the timing of Sandy's landfall significantly affected storm surge elevation. If Sandy had hit during the morning high tide, which was higher than the evening high tide, floodwaters would have been approximately 8 inches higher and storm surge would have penetrated farther inland. If Sandy had struck earlier or later in the day, coinciding with a low tide, storm surge would have been an estimated 42 inches lower. If Sandy had struck about two weeks earlier (or later) during a new moon spring tide, water levels could have been about 18 inches higher or 47 inches (almost 4 feet!) lower, respectively. And finally, had Sandy come ashore during the May 7 spring tide at perigree—an admittedly unlikely event that would have fallen outside the official Atlantic basin hurricane season—storm surge could have been 20 inches higher than observed.
Modeling Tides in the 2015 AIR Hurricane Model for the U.S.
To capture the effects of tidal variation, AIR has developed a tidal adjustment module for the new hydrodynamic storm surge component of our U.S. hurricane model (which also accounts for wind speed and direction, barometric pressure, and other factors that influence storm surge height). The tidal adjustment module captures the effects of 37 different NOAA-identified tidal constituents over the course of the 18.61-year tidal cycle used in the National Tidal Datum Epoch. From neap tides to spring tides and perigee to apogee, the updated module can model tide height at any time and location from the Gulf of Mexico to the Gulf of Maine.
In the tidal adjustment module, a randomly selected year from the 19-year National Tidal Datum Epoch is assigned to each year in AIR's stochastic hurricane catalog. Each landfall in the catalog is assigned a month and day based on a probability distribution of when tropical cyclones are most likely to make landfall, and landfall hour is assigned randomly (landfalls are no more likely at one time of day versus another). These data, along with landfall location (in one of the 62 segments of 50 nautical miles each), determine tide height for that segment. For each event, tide height is adjusted based on the local tidal range and then appropriately interpolated to other areas affected by that storm to calculate tide height for the landfall region.
Managing U.S. hurricane risk is a complex undertaking. Tide height at landfall can make the difference between negligible and truly catastrophic tropical cyclone losses; Hurricane Sandy is just one example, and it is sobering to think that it could have been worse. The ability to model tide height variability at a given location, day of the year, and time of day provides a more realistic and comprehensive view of storm surge risk.
References and Notes
1 Gravitational lag and other factors can shift a high and low tide hours or days before or after a new or full moon.
2 Steacy Hicks, 2006. Understanding Tides. National Oceanic and Atmospheric Administration.
