


A Look Back at the 2014 Price Drop and What’s Ahead for the 2015 Crop Season
Mar 19, 2015
Editor's Note: The drop in corn and soybean prices in 2014 generated an extraordinary level of discussion among crop insurers and reinsurers. In this article we explore the main reasons why. We also look at whether or not the industry would be more resilient to a similar price drop in 2015.
In 2014, the market saw price drops for corn and soybeans following record-breaking yields. For the insurance industry, the conversation quickly turned to the importance of crop prices and the price risk that insurers and reinsurers face. In this article, we explain why the 2014 price drops generated far more concern than very similar drops in 2004 and 2008 did. We also examine how price volatility—the market expectation of price uncertainty—led to a lower premium volume, which was perceived to be insufficient to cover the actual price risk faced by the industry in 2014. Finally, we describe what our experience in 2014 can teach us as we enter the 2015 crop year.
The 2014 Price Drop
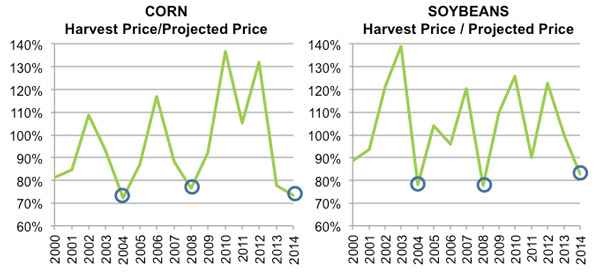
Was the 2014 price drop unique? No. In fact, the price drops from projected to harvest price in 2014 (27% for corn and 18% for soybeans) were very similar to those in 2004 (28% for corn, 22% for soybeans) and in 2008 (24% for corn, 23% for soybeans) as we can see in Figure 1. The years 2004 and 2008 did not generate the same concern in the industry, which tells us that more than price changes drove insurance losses in 2014.
 By: Dr. Gerhard Zuba
Vice President, Senior Principal Scientist
 By: Dr. Julia Borman
Scientist
Edited by Sara Gambrill
The article:
- Industry losses in 2014 are not completely explained by crop price changes.
- Preference for revenue products has increased significantly during the past decade, and the biggest driver of premium rates for these products is price volatility.
- Price volatility needs to be part of the conversation as the industry continues to see growth in price risk from revenue policies.
Growth in Price Risk
We know that price drops were not the sole driver of the industry loss in 2014. The next step in understanding the increased concern in the industry is to compare the price risk for these two crops in 2004, 2008, and 2014. Using the Risk Management Agency (RMA) Summary of Business reports, there are two noticeable trends that have developed in crop insurance product selection over the last decade. First, there is a strong and growing preference for revenue products—which cover both price and yield risk—over traditional yield products, which cover only yield risk. As seen in Figure 2 (left) most of the industry liability (76%) was written in revenue products.
The national portfolio may mask some of the effects, as it considers all crops and not just corn and soybeans. Looking at a single state growing primarily corn and soybeans, such as Iowa, gives a clearer picture. Evaluated alone, we can see that in Iowa almost all liability is written in revenue policies. This is in sharp contrast to 2004 when only about 70% of liability was written in revenue contracts, and in 2008 approximately 85% of liability was written in revenue contracts (See Figure 2, left).
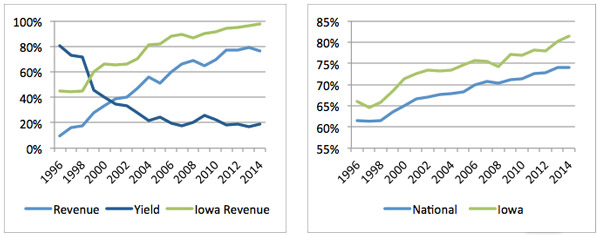
The second trend in product selection is a preference for higher coverage levels. If policies carry higher coverage levels, they are more likely to trigger with a price or yield drop. We see in Figure 2 (right) that on a national level, the average coverage level has been rising over time and is close to 75% in 2014. In Iowa, we see that average coverage levels in 2014 were 81%, up from 74% in 2008 and 73% in 2004.
Was there a growth in price risk in 2014 compared to 2004 and 2008? Yes, but with the growth in price risk, we would expect higher premiums.
Was the Growth in Price Risk Covered?
For the rest of our analysis we focus on the state of Iowa alone. This will allow us to remove any competing state variation that results from looking at premiums at the national level.
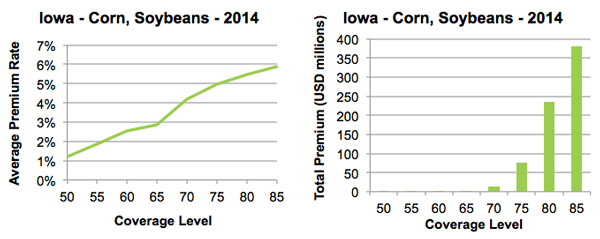
Higher premiums accompany higher coverage levels in all cases to cover the increase in risk. In Figure 3 (left) the increase of the average premium rate by coverage level is shown for corn and soybean revenue policies in Iowa. The average premium rate is an aggregated premium rate for all Revenue Protection (RP) policies sold for corn and soybeans. The dependence of the premium rate on coverage level was calculated with 2014 liabilities and premiums. In Figure 3 (right) we also see that most of the premium in Iowa is associated with RP policies carrying an 80% or 85% coverage level.
There should have been an increase in premium volume of 2.2% given the increase in average coverage levels from 80% in 2013 to 81.3% in 2014 (from Figure 2, right) and the increase in the premium rate between 80 and 85% coverage (from Figure 3, left). This is not what we see, however, when we look at the average premium rate for revenue products1 as shown in Figure 4.
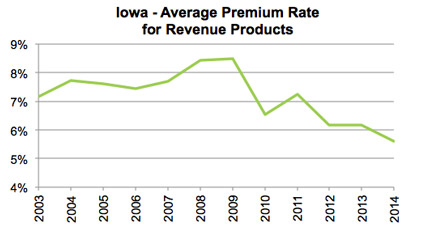
There are a few key observations that can be made from Figure 4. The first is that the premium rate fell from 2013 to 2014. This is the opposite result that would be expected from the increasing average coverage level. Second, there is a slight, upward trend in premium rates from 2003 to 2009 and then a fairly continuous decline in premium rates since 2009, with the exception of 2010 to 2011. These observations indicate there are alternative drivers of the premium rate apart from structural changes, such as revenue product changes, or preference changes, such as the increasing coverage levels.
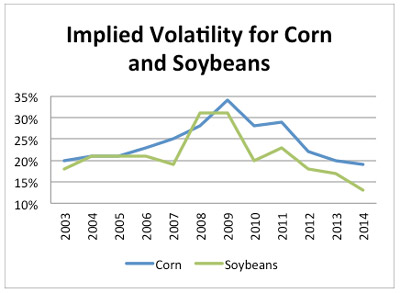
The biggest driver of premium rates for revenue products is price volatility, which determines the revenue uncertainty component for revenue products. As can be seen in Figure 4 and Figure 5, the increase in volatility from 2003 to 2009 also increased the premium rates, and since then the decrease in volatility is reflected in a decrease in premium rates. The uptick in volatility from 2010 to 2011 is also reflected in a corresponding increase in premium rates.
Price Volatility Is Driving Premium Rates for Revenue Policies
Price volatility measures the market's expectations of uncertainty surrounding how the harvest price may differ from the projected price. In a single year, the higher the price uncertainty, the greater the market uncertainty surrounding price outcomes. The final price volatility used for crop insurance rating is an average of the implied price volatility obtained from futures market data during the last five days of February for corn and soybeans.
Thus, the premium rate charged to producers is strongly dependent upon implied price volatility. Figure 7 shows an example revenue protection policy carrying an 80% coverage level in Clay County, Iowa. We can see that as the implied price volatility increases, the premium rate also increases.
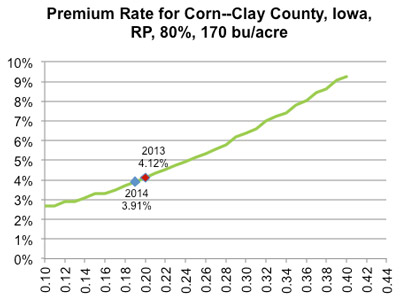
Using Figure 6, we can understand how changes in the implied price volatility would affect premium rate collection. Taking, for instance, the price volatilities (see Figure 5) from 2014 (0.19) and 2013 (0.20), we see in Figure 6 that premium rates would have been 3.91% in 2014 and 4.12% in 2013. This corresponds to a 5% drop in premiums from 2013 to 2014 in Clay County, Iowa. If price volatilities were much higher, then premium rate collection would increase significantly. In 2011, for example, the implied volatility was 0.29 for corn (see Figure 5 ). The premium rate for our sample policy would have been 6.17%—almost 60% higher than in 2014—assuming producers do not change their choices when premiums increase. Thus, if the 2014 price drop had occurred under the 2011 price volatility, the industry would have experienced a much better outcome.
As average coverage levels rise, the impact of the implied volatility on premium volume also rises. If price volatilities fall, the net impact is a reduction in premiums, all else equal. (To learn more about managing risk from price volatility changes, please read New AIR Solutions to Help You Own Your Crop Portfolio Risk.)
What's in Store for the 2015 Crop Season?
Clearly, price volatility needs to be part of the conversation as the industry continues to see growth in price risk from revenue policies, due to preference for these products, as well as higher coverage levels. In addition, price risk will grow as higher effective coverage levels result from policy options such as Trend Adjustment (TA) and Yield Exclusion (YE). The crop season of 2014 indicated that realized price drops can fall in the tail of the market estimation of price uncertainty.
The method for determining price volatility has been under review. A recently released study2 conducted by Sumaria Systems, Inc., considers a number of different volatility rating methods. Sumaria's suggestion is that the general framework of how the market determines the price risk for the season through the futures options in February remain the same; however, the study also suggests some minor changes to the current methodology. These changes would not impact the general observation we made on the dependence of premium rates on implied volatility.
The outlook for the 2015 crop year is positive, as price volatilities have risen for the major crops. Corn has risen from 0.19 to 0.21; soybeans from 0.13 to 0.16; cotton from 0.15 to 0.16; winter wheat from 0.17 to 0.20; and spring wheat from 0.14 to 0.16. We performed an analysis on a sample industry portfolio comprising corn, soybean, wheat, cotton, and barley policies to determine the increase in premiums that might be expected from these increases. Our results indicate that for corn, an increase from 0.19 to 0.21 could result in an 11% increase in premium rate collection in Iowa and 6% for the entire U.S. For soybeans, the increase in price volatility is expected to result in a 13% increase in Iowa, and a 7% increase nationwide. These increases do assume that all else, such as acreage, unit choices, and coverage levels, remain constant at 2014 levels.
Given the increase in price volatilities for major crops in 2015, we expect that the industry will fare better than in 2014 if faced with a price drop of the same magnitude and a yield outcome similar to 2014.
1 Revenue Protection (RP) was introduced in 2011. Previously, the products Crop Revenue Coverage (CRC) and Revenue Assurance (RA), which were very similar, were offered. We use CRC and RA policies to capture revenue protection risk prior to 2011, and RP from 2011.
