


Global Population Movement: An Important Component for Modeling Pandemic Risk
Jun 23, 2014
Editor's Note: According to airline industry forecasts, global air travel is expected to double in the next 15 years. Learn why it is essential to capture population movement in modeling the spread of pandemic diseases and resulting life insurance losses.
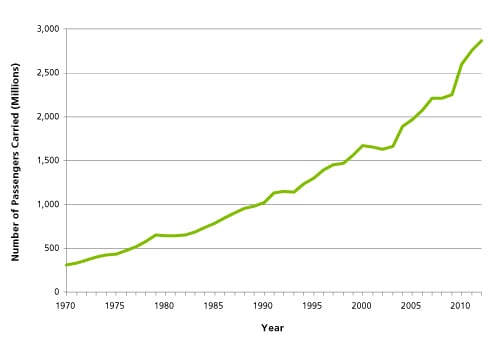
The number of global air travelers increased more than 800% between 1970 and 2012, according to the World Bank1 (Figure 1). The speed of travel has also increased, and so has the connectivity of most regions—meaning that more places are rapidly and directly accessible than ever before. What implications does this dramatic rise in air travel have on the severity of influenza pandemics?
Since historical times, pandemics have spread through human travel. During the Black Death, the outbreak of plague that killed 30–60% of Europe's population in the 1300s, infection spread along shipping routes and overland trading routes. The first flu pandemic to occur in an era of increased global interconnectivity was the 1889 pandemic, which began in St. Petersburg, Russia. By 1889, railroads had become an important mode of long-range travel and were significant contributors to disease spread. During the 1918 "Spanish flu" pandemic, which was one of the worst mortality catastrophes in history, ships and railroads again facilitated global disease spread. The severity of the pandemic was further compounded by troop movements during World War I.
Only three influenza pandemics have occurred since air travel became commercially available. The first was the 1957 flu pandemic, which began in Asia but had spread globally within six months. The 1968 flu pandemic spread quickly, too. During the 2009 "swine flu" pandemic, the initial number of cases in a region was significantly correlated with the number of air travelers arriving from Mexico, where the pandemic likely started.
Modeling the Effects of Global Travel on Pandemic Severity
The Scenarios
A full assessment of the impact of changing travel patterns on pandemic severity cannot be accomplished by using historical data alone; they are simply too sparse. Therefore, for the purposes of this article, we simulated four scenarios using the AIR Pandemic Flu Model. All four pandemic scenarios are hypothetical variants of the 1918 pandemic and include the same disease parameters, but each has a different set of assumed travel patterns. In three of the scenarios, modern mitigation, such as vaccines, antivirals, and antibiotics (which combat bacterial co-infections), is also assumed (see Table 1).
| Scenario | Modern Population | 1918-Like Disease Parameters | Modern Mitigation | Modern Travel | 1918 Civilian Travel | 1918 Troop Movements |
|---|---|---|---|---|---|---|
| 1 | X | X | X | X | ||
| 2 | X | X | X | X | ||
| 3 | X | X | X | X | X | |
| 4 | X | X | X | X |
 By: Nita Madhav, MSPH, CCM
Senior Scientist, Research & Modeling
Edited by Dr. Molly J. Markey
Highlights:
- Changing global travel patterns have a significant impact on pandemic severity, as illustrated in four simulated scenarios
- Air traffic varies regionally and affects where a pandemic may first take hold (find out what the top 10 cities for pandemic importation are)
- Travel restrictions may not be an effective strategy for pandemic containment
- Explicitly including travel in disease spread models represents an upgrade over traditional epidemiological methods
Scenario 1 accounts for modern mitigations and modern travel patterns (a scenario previously discussed in Modeling a Modern-Day Spanish Flu Pandemic).
Scenario 2 also includes modern mitigations, but 1918-like civilian travel patterns rather than modern travel. Based on historical maps and international statistics, we identified major seaports of the time period. We estimated ship capacities using passenger manifests and counts from civilian ships, and foreign commerce data for principal ports published by the U.S. Census Office in 1918. In addition, we estimated the frequency and speed of civilian travel using contemporaneous travel advertisements and distances between ports.
Scenario 3 is identical to Scenario 2, except U.S.-to-Europe troop movements have been added. Data from the U.S. Army Center of Military History indicate that, during the summer of 1918, U.S. troops were arriving in France at the remarkable rate of 10,000 troops per day.
Scenario 4 is identical to 3, except modern mitigation measures are not included—making Scenario 4 the most similar of these four variants to the actual 1918 pandemic.
The Results
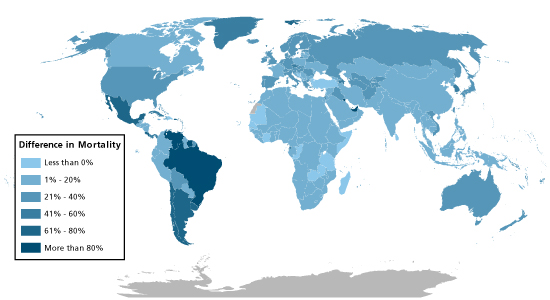
Between 1918 and the present day, the number of civilian long-distance travelers has increased about 20-fold, and there has been a 14-fold rise in the number of direct links from place to place. These dramatic changes in travel patterns cause mortality from Scenario 1 to be much higher than from Scenario 2, as shown in Table 2 (for seven selected countries) and Figure 2 (for all countries). The higher death rate in Scenario 3—which includes military travel—compared to Scenario 2 underscores the impact of the massive influx of troops from the U.S. to Europe on pandemic deaths. The dramatically higher mortality in Scenario 4 compared to Scenario 3 demonstrates the critical role of modern mitigation measures.
| Scenario | Number of Deaths in the U.S., UK, Japan, Germany, France, Canada, and Australia |
|---|---|
| 1 | 577,000–637,000 |
| 2 | 437,000–483,000 |
| 3 | 503,000–555,000 |
| 4 | 6,505,000–7,189,000 |
Looking more closely at Scenarios 1 and 2, the differences in mortality vary by country. Among the U.S., UK, Japan, Germany, France, Canada, and Australia, the increase in mortality in Scenario 1 compared to Scenario 2 is roughly 30% (see Table 2). However, in parts of Latin America, and in the United Arab Emirates, Scenario 1 inflicts over 80% more deaths than Scenario 2 (Figure 2). These areas have experienced significant increases in travel since 1918 relative to the more well-developed countries. According to airline industry sources, Brazil and Mexico are now Latin America's two largest markets for air travel. In addition, air traffic to and from the Middle East has increased by 236% since 2000, largely driven by flights serving Dubai.
Modern-day travel patterns have far-reaching effects on pandemic risk. As a country becomes more globally connected and the pace of travel increases, a pandemic can reach that country more quickly, potentially causing the peak of the pandemic to occur sooner at that location. This could have serious consequences for public health. For example, in Scenario 1, the pandemic peaks in many countries in about six months, which is about when a vaccine to defend against the pandemic is likely to become available. In Scenario 2, slower travel causes a delay in disease spread that allows time for a vaccine to be developed and distributed before the pandemic peaks.
A second effect of increased travel is a greater degree of simultaneous effects in different parts of the world. With a pandemic reaching many corners of the globe at nearly the same time, medical facilities, containment, and mitigation efforts are more likely to be overwhelmed, leaving more people without access to appropriate care and prevention measures.
Explicit Modeling of Population Movement Improves Pandemic Risk Estimates
In the AIR model, local person-to-person disease spread is simulated using a Susceptible-Exposed-Infectious-Removed (SEIR) model, which is a well-known epidemiological model. The traditional SEIR method, however, does not include a population movement component; that is, it unrealistically models flu spread through the global human population—over 7 billion people—as occurring at a single location.
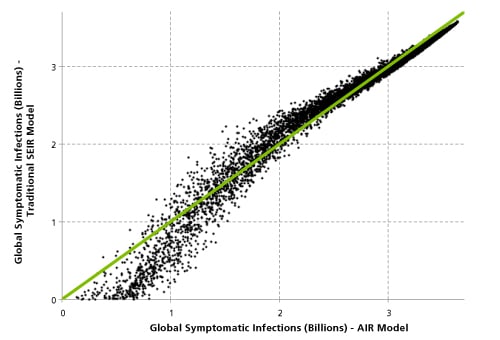
AIR improves upon the traditional approach by explicitly simulating long-range population movement. By taking into account global flight patterns and the number of travelers arriving at and departing from each destination, the model can capture the effects of global travel on disease spread dynamics. To reveal the impact of including long-range travel, we used the AIR model to estimate the number of infected people in over 6,500 hypothetical pandemics, and compared these estimates to the estimate from a traditional SEIR model.
As Figure 3 illustrates, events with lower global infected counts (which have a higher occurrence probability) are underestimated by the traditional model. The traditional SEIR model overestimates the impact in middle ranges of severity, as compared to the AIR model.
Conclusions
Pandemics are global events, and, with today's unprecedented level of global travel and interconnectivity, diseases can achieve worldwide spread at a record pace (watch this video to see a simulated scenario). According to airline industry forecasts, the level of global air travel is expected to double in the next 15 years. Future travel changes could have a significant impact on pandemic risk. The AIR Pandemic Flu Model, which explicitly models population movement, can help to more accurately quantify this risk.
1 These data are only available from the World Bank for 1970-2012 (http://data.worldbank.org/indicator/IS.AIR.PSGR).
