


Water, Water Everywhere
May 23, 2013
Editor's Note: Flooding is one of the most pervasive natural disasters, affecting nearly every inhabited region of the world and causing average annual economic losses exceeding USD 25 billion. AIR is addressing the need for risk quantification by developing new and enhanced modeling capabilities for storm surge, precipitation-induced inland flooding, and tsunami. This article explains the differences between these distinct flood types.
Throughout history, flooding has impacted more people and caused greater economic and insured losses than any other natural peril. For example, half of the more than USD 40 billion in insured losses that stemmed from Hurricane Katrina in 2005 was related to storm surge. The tsunami that devastated the northern coast of Honshu in March 2011 is estimated to have caused insured losses of USD 3.5 billion. And economic losses following the riverine flooding in Thailand later that year were estimated by the World Bank to be USD 45.7 billion (THB 1.4 trillion).i
Over the past decade, flooding in its various forms has generated an average of USD 25 billion in economic losses annually, including approximately USD 6 billion in the United States, a country with sophisticated flood mitigation and prediction systems. This article explores the affected regions, frequencies, physical characteristics, and damage mechanisms of different forms of flood, all of which are important for understanding how to cope better with this pervasive peril.
Types of Floods
Of the many different ways to classify floods, the two major categories—inland and coastal—highlight the underlying causal mechanisms. Coastal floods occur as a result of a force that pushes or pulls water from the ocean (or large lake) onshore. The forces can be wind (e.g., from tropical or extratropical cyclones), sudden displacement of ocean water (tsunami), or gravitational pull in the case of astronomical tide.
Inland floods result from unusual amounts of rain falling (or snow melting) and overwhelming drainage systems. The precipitation may come from thunderstorms, tropical cyclones, winter storms, or monsoons, and may fall in a matter of minutes or over several months. All of the many types of flood this precipitation causes—gradual riverine flooding, rapid flash floods, dam failure, etc.—can be classified as rainfall-induced floods (RIFs) because, ultimately, they are caused by water falling from the sky.
 By: Dr. Peter Sousounis
Senior Principal Scientist
 By: Jonathan Kinghorn
Writer
Edited by Nan Ma, CCM
The article: Explores the affected regions, frequencies, physical characteristics, and damage mechanisms of different forms of flood.
Highlights: The frequency of floods varies considerably across flood type: inland floods causing insured losses of at least USD 1 billion occur on an almost annual basis, storm surges of the same loss threshold occur every few years, and tsunamis of that magnitude are rarer. Companies need to have a deep understanding of their exposure to flood and enterprise-wide loss potential.
Location, Extent, and Frequency
Because precipitation is the driver, RIFs can happen in many parts of the world (with the exception of deserts). Most regions within 60° of the equator are possible targets. The presence of copious precipitation along with sloping terrain, impermeable underlying surfaces, and antecedent soil moisture all contribute to the possibility of a flood. A single RIF can affect a large region—especially when a major river system is involved. In 2002, 252,000 km2 of central Europe flooded and in 2007, 1,916,000 km2 in southern China was inundated.
Storm surges and tsunamis are coastal phenomena, but it is important to note that 40% of the world's population lives within 60 miles of a coast. Because strong sustained onshore winds are required to generate them, surges are typically possible only from tropical and extratropical cyclones. The risk extends, however, to high latitudes, where a winter storm (extratropical cyclone) caused the Great North Sea Flood of 1953.
The width of the surge footprint is comparable to the width of the storm, unless a quasi-parallel shoreline track lengthens the coastal extent—potentially from tens to hundreds of kilometers. The inland penetration typically extends no more than 10 km.
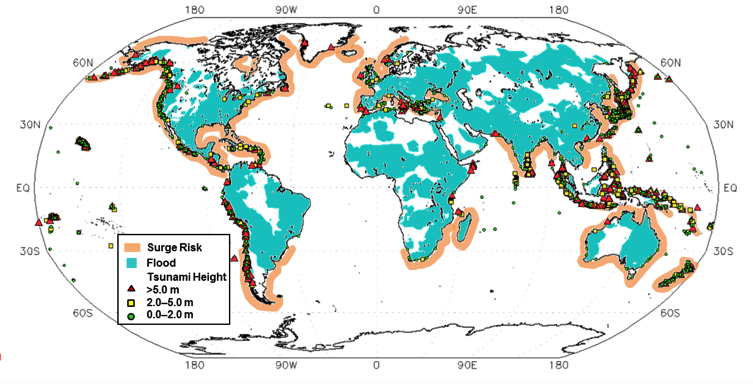
Tsunamis can also affect a large latitude span; they have occurred as far north as Alaska and as far south as Australia (see Figure 1). Tsunamis can impact several thousand kilometers of coastline and, because of their higher velocity at the coast, they can penetrate farther inland than storm surges. In the case of both tsunami and storm surge, the presence of an astronomical high tide at the time of impact can further enhance the inundation footprint.
The frequency of floods varies considerably across flood type. RIFs that involve major rivers or large urban areas and cause insured losses of at least USD 1 billion occur on an almost annual basis. Large storm surges of the same loss threshold are slightly less frequent, occurring every few years. Tsunamis of that magnitude are much rarer.
Predictability
RIFs can often be predicted, typically a few days in advance for larger-scale events. As tropical cyclones approach their landfall location, for example, their inland track and rainfall characteristics are known fairly accurately. Similar predictability exists for storm surge because it is the result of large-scale weather systems and weather forecasting on this scale is generally quite accurate. While the exact landfall location and the extent of the area that will be affected are not known with certainty, a stretch of the coast is usually put on alert to expect potentially damaging surge conditions.
Tsunamis are very different. Depending on how far offshore the earthquake rupture (or landslide) occurs, there may only be a few minutes of lead time before waves arrive at the coast. The Tohoku earthquake struck 150 km offshore and the tsunami reached the closest shores just 20 minutes later. Shallow water, bays and inlets can slow the advancement of the wave, providing additional precious time for evacuation, but they can also amplify the height of the waves. Fortunately, when a tsunami propagates across an entire ocean, it can take 10-15 hours, and the amplitude (height) of the tsunami will be somewhat diminished. It is the lack of predictability and the much reduced warning time that give tsunamis the highest historical mortality rate per event of all three flood types.
Damage Mechanisms
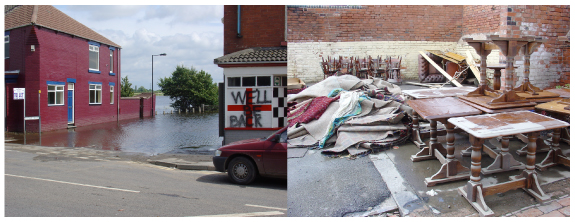
The different flood types cause damage in different ways. For RIFs, damage to property results primarily from water depth, especially if water velocity is not a contributing factor due to the distance from the river and/or local terrain characteristics. Deep water can lift buildings from their foundations, and if there is a water height differential across the structure, hydrostatic force can be another source of damage. Contents in basements and ground floors can also be damaged.
For coastal floods, water velocity, in addition to water depth, can be a significant source of damage, especially if carrying debris. Water velocity for surge can typically be several meters per second. (Water moving at a 4 m/s exerts the same pressure on structures as wind gusts of 400 km/h.) Breaking waves can exacerbate damage by extending the height and the hydrodynamic force of the water, and their velocity is even greater than that of the current on which they are riding.
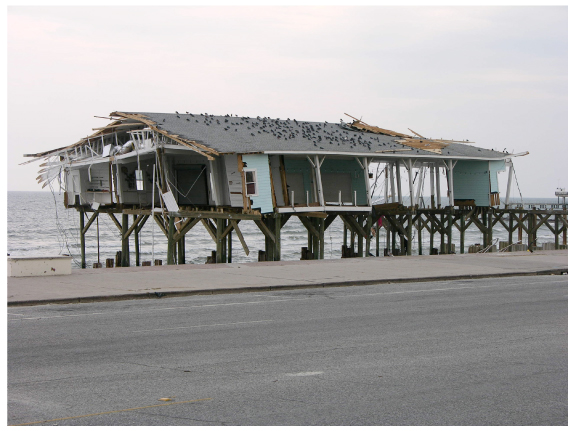
For tsunami, the impact of velocity and breaking waves can be exceptional. Tsunami waves can move onshore at 10-15 m/s and breaking waves can inundate objects at heights exceeding 20-40 m. Because tsunami waves are typically characterized by a series of crests and troughs, there can be multiple inundations during a period of several hours. In contrast, storm surge is a single dome of water comparable in size to the storm, so these features are not present.
Importantly, both storm surge and tsunami damage result from saltwater, which can corrode machinery and contaminate agricultural land.
An Insurance Conundrum
While casualty figures have fallen as warning systems have improved, insured flood losses have increased dramatically, principally because of the continued development of property in areas at risk and the growing value of that exposure. The insurance industry is being challenged by these rising losses, and the viability of flood insurance is in question.
| Event | Year | Insured Loss Indexed to 2012 (USD millions) | Notes |
|---|---|---|---|
| Hurricane Katrina U.S., Gulf of Mexico, Bahamas, North Atlantic |
2005 | 76,254 | Storm surge triggered widespread levee failures. It is estimated that half of the losses were a result of flooding in New Orleans. |
| Tohoku Earthquake and Tsunami Japan |
2011 | 35,735 | A massive tsunami brought waves of up to 40.5 m (133 ft), which traveled up to 10 km (6 mi) inland in the Sendai area. |
| Hurricane Sandy U.S. |
2012 | 35,000 | Sandy brought coastal flooding to Cuba, Haiti, and the entire eastern seaboard of the U.S. Its storm surge hit New York City on October 29, flooding streets and tunnels and cutting power. |
| Hurricane Andrew U.S., Bahamas |
1992 | 26,180 | Storm surge is estimated to have caused more than USD 500 million in losses. |
| Northridge EQ U.S. |
1994 | 21,685 | |
| Hurricane Ike U.S., Caribbean, Gulf of Mexico |
2008 | 21,585 | Storm surge caused significant coastal damage in Louisiana and Texas. Farther inland, rains associated with the system's remnants caused flooding in the Midwest. |
| Hurricane Ivan U.S., Caribbean, Barbados |
2004 | 15,672 | Ivan brought torrential rains, storm surge flooding of 3-5 m (10-16 ft) above normal high tide, and battering waves along the western Florida Panhandle and the Alabama coastline. |
| Floods Thailand |
2011 | 15,315 | Sixty-five of Thailand's 77 provinces were declared flood disaster zones, and more than 20,000 km2 (7,700 mi2) of farmland was damaged. |
| Christchurch EQ New Zealand |
2011 | 15,315 | |
| Hurricane Wilma U.S., Mexico, Jamaica, Haiti |
2005 | 14,772 | Storm surge caused significant damage to low-lying areas of the Keys, and heavy rains caused inland flooding. |
Although flood is a global peril, flood insurance is not available uniformly around the world. In Asia, the continent most affected by floods, flood insurance is at an early stage of development. China experienced one of its worst floods in recent history in 2010, but only 1-2% of total economic losses (estimated at USD 50 billion) were covered by insurance.iii Even in more developed economies where coverage is more widely available (e.g., Europe, Japan, and the United States), take-up rates are often very low. For example, only about 20% of Americans whose homes are at risk are covered. There are many reasons for this, but chief among them is that flood insurance suffers from adverse selection—generally only those in high-risk areas are interested in purchasing it. As a result, it is not possible to offer it at rates acceptable to the private insurance market.
Governments have adopted various solutions to the problem. In Europe, most provide state-backed pools or compensation funds that spread the cost among all taxpayers. In the Netherlands, the government is working with the Dutch Insurance Association to set up a flood pool backed by a vast reinsurance treaty, which will be the third biggest catastrophe placement to date if realized. And in the United States, the federal government provides insurance directly through the National Flood Insurance Program.
In Germany and the UK, which account for nearly 75% of European insured flood losses, coverage is provided mainly by private insurers. Flooding is the second highest source of insured loss in Germany, but coverage is typically non-compulsory. In the UK, flood coverage is included in standard policies under an evolving informal public-private partnership whereby the industry agrees to provide affordable insurance while the government invests in flood defenses. The future of this joint agreement, due to expire in 2013, is currently in question.
Preparing for the Next "Surprise"
The record-breaking coastal flooding that accompanied Hurricanes Katrina and Sandy underscores the fact that when a hurricane makes landfall, it is often storm surge that is the greatest threat to life and property in the immediate area. The devastation of the Tohoku region in 2011 proved that tsunami can be a principal driver of casualties, damage, and insurance losses following a major earthquake. And in the precipitation-induced inland floods in Germany (2002) and the UK (2007), nearly 50% of the loss occurred off the floodplain, much of it in highly exposed urban areas.
Events like these demonstrate the need for catastrophe modelers and insurers to fully understand the evolving nature of this peril, in all of its forms. AIR's scientifically robust, transparent models enable clients to have a deep understanding of their exposures and enterprise-wide loss potential. In addition to the introduction of the industry's first fully probabilistic tsunami model in 2013, AIR's Research Roadmap for the next few years includes several new detailed inland flood models, enhanced storm surge modeling, and the rollout of sophisticated flood hazard maps for regions around the world.
i World Bank (http://www.worldbank.org/en/news/feature/2011/12/13/world-bank-supports-thailands-post-floods-recovery-effort)
ii Columbia University (http://sedac.ciesin.columbia.edu/es/papers/Coastal_Zone_Pop_Method.pdf)
iii Guy Carpenter (http://www.guycarp.com/portal/extranet/press/PDF/2010/101220_China%20Flood%20Report)
