


Uncovering Florida Hurricane Risk with the Catastrophe Bond Database
Nov 22, 2013
Editor's Note: In this article, Justin Pierce discusses interesting insights that can be revealed by analyzing AIR's comprehensive database of catastrophe bonds (or, more simply, cat bonds) to help investors gain a better understanding of the catastrophe risks prevalent in the current market.
Introduction
As the insurance-linked securities market (e.g. catastrophe bonds, industry loss warranties, sidecars, and collateralized reinsurance) continues to grow, investors need sophisticated tools to understand the risks of this asset class.
AIR offers a comprehensive catastrophe bond database ("cat bond database") that contains critical information on all current on-risk1 bonds in the marketplace (117 at time of this writing), both those for which AIR was the original modeling agent and those that AIR has remodeled based on securitization offering documentation. The database includes details of each bond's exposures, triggers, covered perils, risk period, principal amount, spread, rating, CUSIP, and more.
In the following analyses, we explore the characteristics of four simulated Florida events from AIR's standard U.S. hurricane catalog and the impact their modeled losses have on current bonds. This market portfolio analysis can reveal factors that make it possible for seemingly small, or weak, events to cause significant loss to investors, and indeed factors that may prevent larger events from causing such loss. Cat bond investors need to consider these factors when making investment decisions to reduce the risk of potentially significant portfolio losses, react to events in real-time, and optimize returns. The ability to analyze the full suite of potential risks can help investors enhance their understanding of the cat bond market, before undertaking a narrower analysis of a subset of bonds, or even of a single bond.
 By: Justin Pierce
Risk Consultant, Consulting and Client Services
Edited by Eric Bland
The article: Using AIR's cat bond database, this article explores potential impacts on the cat bond market of four simulated Florida hurricanes.
Highlights: A Florida-landfalling Category 5 hurricane would cause high loss to the cat bond market, but other less powerful storms can also cause significant loss. Even similar storms can cause dramatically different losses to the cat bond market as a result of the concentration of insured properties they affect. Investors need sophisticated tools to consider a comprehensive range of factors when making investment decisions.
An Examination of Two Category 5 Florida Landfalls
The U.S. wind peril dominates the cat bond market. In fact, a quick query of the cat bond database reveals that 64% of all bonds in the market have some component of Florida hurricane risk. It should come as no surprise that a Category 5 hurricane hitting Florida is a very serious risk for cat bond investors, but would it wipe out the market? Landfall location and hurricane intensity, while certainly important, are not the only factors that cat bond investors need to consider. Pre- and post-landfall activity, along with the bond's structure and the insurance risk that each bond is intended to cover will be critically important to determining a tropical cyclone's effect on the cat bond market.
Consider the two events shown in Figure 1 that have roughly similar landfall locations, Saffir-Simpson categories, and tracks.
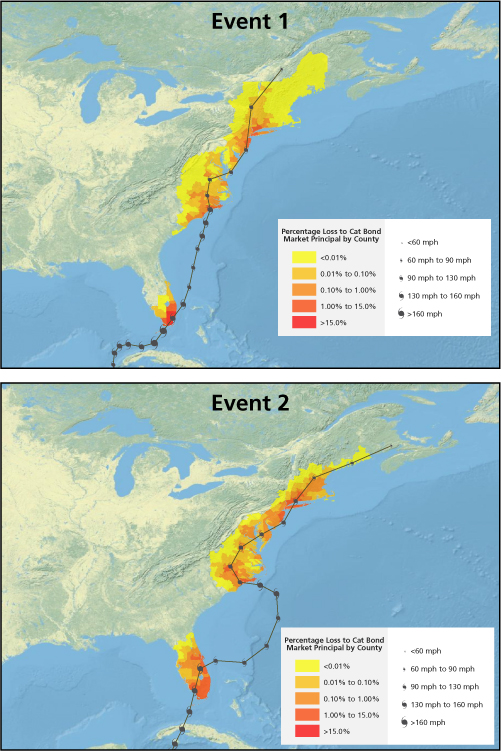
Event 1 is the largest loss-causing event to the cat bond market in AIR's 10,000-year standard hurricane catalog. This simulated storm makes its first landfall in Monroe County, Florida, at Category 5 intensity and then strikes Miami before heading back out to sea. It makes a second landfall in North Carolina as a Category 4, passes into and then out of Virginia, and continues up the East Coast. It makes its third and final landfall near the New York/New Jersey border at Category 3 intensity.
This low-probability but still plausible loss from this event has an exceedance probability of just 0.01% and equates to total industry insured market loss of USD 386.5 billion — roughly eight times that of Hurricane Katrina. The event triggers 68% of tranches in the market today (i.e., causes at least $1 of loss) and causes 60% of principal loss to a roughly USD 17 billion asset class of property catastrophe bonds.
Event 2 is also a Category 5 hurricane making initial landfall in southern Florida, a second, Category 4 landfall in North Carolina, and a third and final landfall in the New York/New Jersey area as a Category 2 storm. This event loss, which has a probability exceedance of 3.84%, equates to total industry insured market loss of USD 54.9 billion. Event 2 triggers 21% of tranches in the market, causing slightly over 12% of cat bond principal loss.
Events 1 and 2 are broadly similar, including number of landfalls, affected states, and Saffir-Simpson category at first landfall. However, their loss to the cat bond market differs dramatically, primarily as a result of the concentration of insured properties they affect.
Event 2 makes landfall in Collier, Florida, one county north of Event 1, and continues north-northwest. This means that, unlike Event 1, it misses the three areas of Florida with the heaviest concentration of insured cat bond exposure—Miami-Dade, Palm Beach, and Broward counties. The majority of principal loss in Event 2 results from indemnity transactions covering North Carolina and the Northeast region that, while significant, are relatively small compared to the potential losses that Florida can generate.
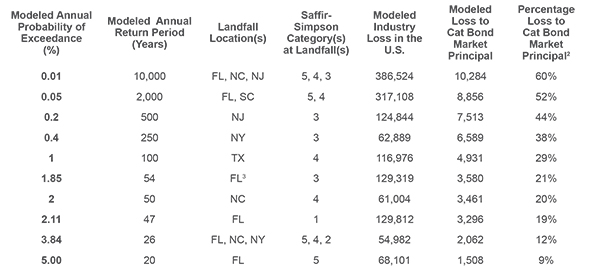
AIR's cat bond database can be used to understand the implications other Category 5 Florida-landfalling hurricanes would have on the cat bond market. Table 1 shows the number of bonds triggered by modeled Category 5 hurricanes making first landfall in Florida and indicates how many bonds would be triggered at different percentiles. For example, 50% of all modeled Category 5 hurricanes that make landfall in Florida trigger 18 or fewer bonds in the market.
| Percentile | Number of Bonds Triggered |
| 75th | 48 |
| 50th | 18 |
| 25th | 5 |
Could Weaker Hurricanes Cause Significant Loss to the Market?
AIR's U.S. hurricane catalog includes tens of thousands of simulated hurricanes varying in strength, size, speed, and track. Bypassing events that do not make direct landfall can still generate significant loss. Consider two less severe events that affect Florida.
Event 3 is a Category 1 hurricane that makes landfall on the Florida panhandle. Based solely on landfall location and storm strength, this storm may not appear to be a significant threat to the market. However, the hurricane triggers 33% of tranches in the market and causes roughly 19% principal loss (more than the Category 5 Event 2 discussed above).
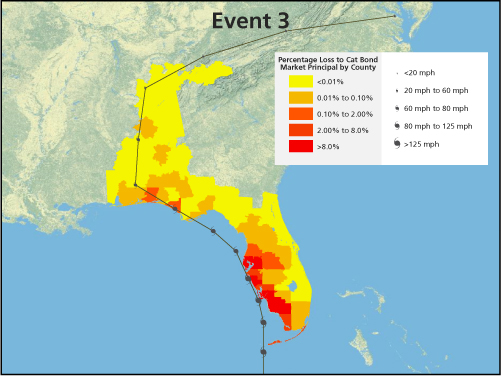
Much of this loss (80%) comes from the west coast of Florida, even though the storm does not make landfall here. However, as it travels parallel to the coast, the strongest winds (which are on the right-hand side of storm tracks in the northern hemisphere) pass over high concentrations of exposure value, including the cities of Naples and Tampa. Gulf County, in Florida's panhandle, where landfall finally occurs, contributes less than 0.01% of the total loss
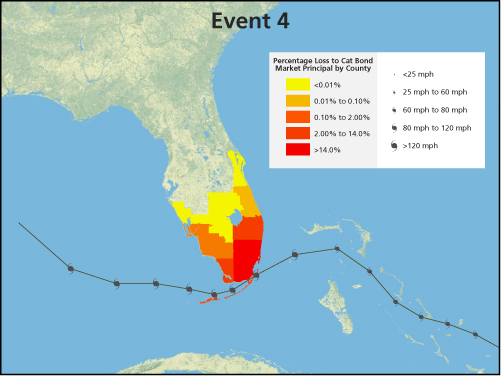
Event 4 is another bypassing event from AIR's 10,000-year catalog that causes significant loss. This event bypasses the southern tip of Florida as a Category 3 hurricane, triggering 26% of tranches in the market and causing roughly 21% of principal loss, virtually all of it in the heavily-exposed counties of Miami-Dade and Monroe.
Because hurricane winds can extend hundreds of miles in diameter, winds, rain, flooding, and storm surge can generate high losses, even if the eye never crosses the coastline. Bypassing hurricanes, by staying over the warm water from which they derive their energy, can maintain intensity or even strengthen as they batter coastal properties.
Additional Benchmarks
Table 2 shows a small sample of the annual occurrence loss distribution for the cat bond market as of 9/30/2013, generated using CATRADER®'s cat bond database and the AIR U.S. hurricane model. Table 2 gives an indication of the types of events that cause significant loss to the cat bond market. All events discussed in this article have been included in this table for reference.
Concluding Remarks
The examples presented in this article represent just a few of the many ways investors can use AIR's cat bond database. While these analyses focused on Florida wind-exposed bonds, similar analyses can be performed for other perils and regions worldwide. For portfolios that include other risk transfer structures, such as industry loss warranties or collateralized reinsurance, AIR can guide investors on the best way to model such transactions.
To manage the growing number of investment opportunities in this asset class effectively and profitably, investors need a comprehensive understanding of their risk. CATRADER, and its fully integrated cat bond database, represents a powerful portfolio management tool.
1 An on-risk bond is one that is currently exposed to catastrophe risk. The total lifespan of the bond may include periods during which it is not exposed.
2 Assumes approximately USD 17.1 billion of outstanding principal (as of 9/30/2013)
3 Indicates bypassing storm
