


The 2012 U.S. Drought and What to Expect from the 2013 Crop Season
Apr 29, 2013
Editor's Note: A previous AIR Current discussed how the 2012 U.S. drought developed, its effects on U.S. agriculture, and how it compared with previous droughts. This AIR Current compares AIR's loss estimate issued in November against the most recent (April 22) RMA data and describes key differences from a weather and crop loss perspective between the 2012 drought and the 1988 drought. It also looks ahead to what is in store for the 2013 planting season.
In 2012, the U.S. agricultural sector was affected by a severe drought. Dry conditions and record warm temperatures persisted throughout the winter of 2011/2012 and into the summer. By the end of September 2012, 65.6% of the contiguous U.S. was affected by moderate to exceptional drought. Crop insurers began comparing the situation to the historic drought of 1988, which was the second most expensive U.S. weather disaster since 1980. That event caused economic losses of USD 77.6 billion (adjusted to 2012 dollars), and the associated heat wave caused 7,500 deaths.1
Given the many similarities in the weather patterns in 1988 and 2012, how do these droughts really stack up? This article takes a look at the growing conditions and compares industry losses from 1988 with modeled and reported losses from 2012. Then we take a look at what we can expect for the 2013 season and introduce AIR's Seasonal Portfolio Monitoring Service to help companies assess the risk to their portfolios.
Comparing the Droughts of 1988 and 2012
The 1988 agricultural drought was the most severe that the U.S. agricultural sector experienced in the last quarter century. Precipitation became erratic in early summer and by mid-July, moisture levels were severely depleted in the major corn-producing states, including Illinois, Indiana, and Minnesota. By mid-August, the dry conditions had spread into Iowa and the Corn Belt. According to the Risk Management Agency (RMA), indemnities totaled nearly USD 1.1 billion (in 1988 dollars) and the gross loss ratio for the crop insurance industry was 245% (based on 1988 insurance products and premium rates).2
 By: Dr. Gerhard Zuba
Senior Principal Scientist
 By: Dr. Oscar Vergara
Manager, Business Development
Edited by Sara Gambrill
The article: Describes key differences between the 2012 and 1988 droughts, compares AIR's loss estimates against the most recent (April 22) RMA data, and discusses what's in store for the 2013 crop season.
Highlights: The AIR Seasonal Portfolio Monitoring Service can help companies better plan their reserving needs and forecast potential gains and losses as the 2013 growing season progresses.
By contrast, in 2012, above-normal temperatures in the spring led to an early start to the growing season and favorable crop production potential. However, lack of summer precipitation and exceptionally high temperatures exacerbated the moisture deficit from a dry winter, greatly reducing the harvest potential of major crops like corn and soybeans. Then, in September, rain brought by remnants of Hurricane Isaac alleviated the heat and moisture stress on soybean crops in the Corn Belt. The precipitation salvaged the 2012 soybean crop yield and cut the crop insurance industry losses significantly. But it was too late for the corn crop. According to the USDA National Agricultural Statistics Service (NASS), corn yield was as much as 25% below normal, while the reduction in soybean yield was a more modest 15% below normal.3
Figure 1 shows the sub-surface soil moisture levels for the Corn Belt states during the spring-summer months of 1988 and 2012.
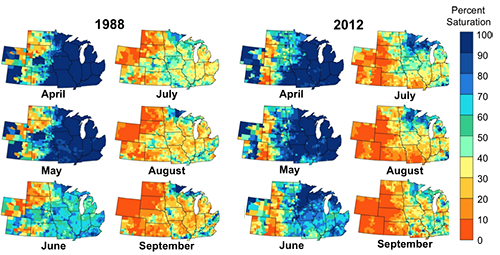
The two drought events were similar in terms of the extent of the area damaged, duration of the event, and weather triggers. Losses, on the other hand, tell a very different story; for several reasons that will be further described here, 2012 drought losses did not surpass 1988 drought losses.
Industry Losses from 2012
Table 1 shows AIR's modeled crop insurance industry loss estimates as of November 2012 (provided to the industry through the CropALERT® service), which was calculated by running real-time crop portfolio analyses based on county-level yield estimates for corn and soybeans in November.
| Range | Gross Premium | Gross Loss | Gross Loss – Premium | Gross Loss Ratio |
|---|---|---|---|---|
| Upper | 11 Bln | 17.2 Bln | 6.2 Bln | 156% |
| Lower | 11 Bln | 15.3 Bln | 4.3 Bln | 139% |
| Range | Retained Premium | Net Loss | Net Loss – Premium | Post – SRA Loss Ratio |
| Upper | 9.3 Bln | 10.9 Bln | 1.6 Bln | 117% |
| Lower | 9.3 Bln | 10.1 Bln | 786 Mln | 108% |
Based on gross premiums of USD 11 billion for the 2012 crop season, AIR estimated an industry gross loss ratio of between 139% and 156%. Once the Standard Reinsurance Agreement (SRA) protection to the industry is taken into consideration, the potential losses are reduced to a range of 108% to 117%.
As of April 22, the RMA reported a gross loss ratio of 153%.4 The post-SRA loss ratio is 113.7% as of April, which compares favorably with AIR's estimated post-SRA loss ratio (see Table 1). AIR's loss forecasting capabilities are notable considering that the estimates were produced during the height of the drought amid high uncertainty about county yields.
The industry loss ratios in 2012 were less than they were in 1988 for several reasons. As previously mentioned, rains from Hurricane Isaac's remnants in September helped boost soybean yields. Also, Minnesota was only minimally impacted, with 93% of normal production for corn. On the financial front, crop insurance program participation in the Corn Belt as well as in states peripheral to it was higher in 2012—so areas not impacted by the 2012 drought offset losses from areas that were affected—as was per-policy premium collected. On the government front, the current SRA provides a significant amount of industry protection when a catastrophic event, such as a drought or flood, occurs.
In addition, states peripheral to the Corn Belt—especially Southern states east of Texas, and states on the West Coast, such as California—had a favorable growing season, which translated into underwriting gains that compensated for some of the losses in the areas of the country most affected by the drought. For many counties in the Corn Belt, however, the 2012 drought was as bad as in 1988—and in some counties, it was worse. However, the Southeastern states from Arkansas to Georgia to Virginia all had positive gross loss ratios, as did California. Industrywide, on a post-SRA loss ratio basis, AIR estimates that the 2012 drought loss corresponds to a 5% annual probability of exceedance—equivalent to a 20-year return period—while the 1988 drought loss has a 2% probability of exceedance in a given year, equivalent to a 50-year return period.
Looking Ahead at the 2013 Crop Season
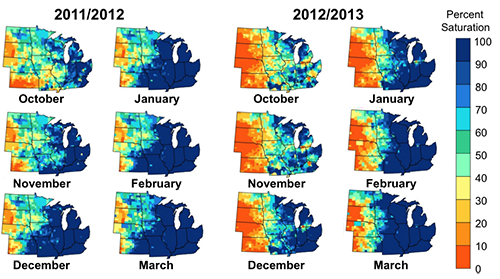
A substantial soil moisture deficit continued into the last months of 2012, especially in North Dakota, South Dakota, and Nebraska, as well as the Wheat Belt of Kansas, Oklahoma, and Texas.5 However, a significant amount of precipitation has already fallen in 2013, which has eased drought conditions.
As of this publication, there are still a few pockets of persistent drought in the western parts of South Dakota, Nebraska, and Kansas, but overall the moisture levels in the Corn Belt have recovered. In fact, weather patterns that bring heavy precipitation into the Central Plains have some speculating whether wet conditions and spring flooding might actually delay the forthcoming spring planting. Planting in 2013 will certainly start later than in 2012. (The wet summer of 2011 followed by adequate precipitation and mild temperatures ahead of planting contributed to making the 2012 planting season one of the earliest on record.) See Figure 2 for a comparison of the progression of soil moisture levels going into the 2012 season (left) and the 2013 season (right).
CMI vs. PDSI
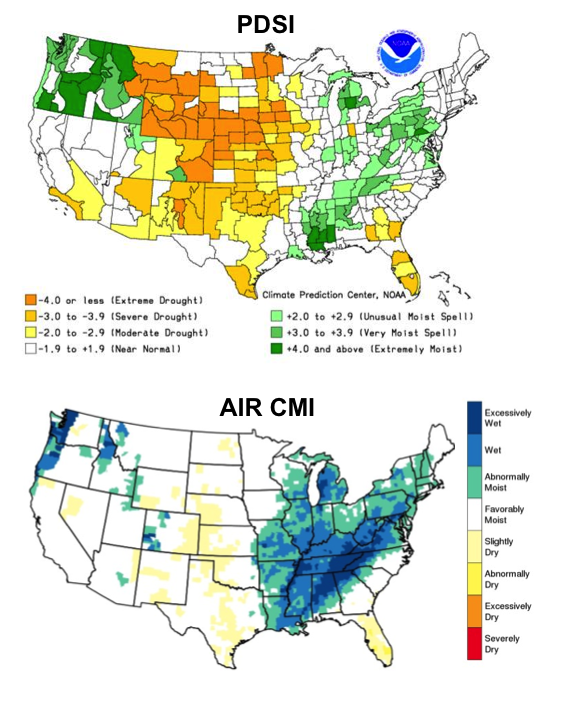
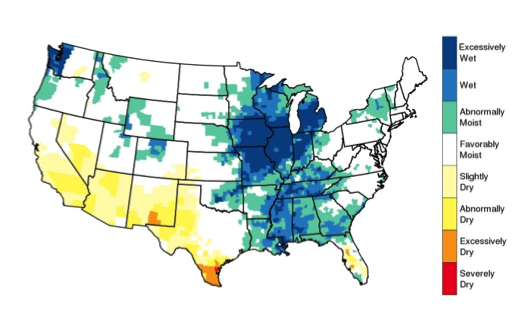
The Palmer Drought Severity Index (PDSI) and the Crop Moisture Index (CMI) both capture overall patterns of wetness/dryness. The major difference between them is that the CMI captures short-term relief provided to crops from precipitation, while the PDSI is better at capturing the long-term moisture deficits that can lead to hydrological droughts. The CMI shows a return to normal moisture levels as soon as they are recovered in the soil's top layers, so it shows much higher variability than the PDSI. Thus, the CMI is a better measure for agricultural drought monitoring, and AIR uses a modified (higher resolution) version of this index to more accurately capture the short-term water availability for crop production. (See Figure 3.)
According to the National Agricultural Statistics Service (NASS), the percentage of wheat in poor to very poor condition declined significantly in the last three months (see Table 2).6 However, despite significant improvement in crop conditions, the winter drought of 2012/2013 has already damaged winter wheat, which will reduce profitability this year. Of course, the full impact will not be known until the summer harvest.
| Winter Wheat | In Poor to Very Poor Conditions | ||
|---|---|---|---|
| January | February | March | |
| Kansas | 39% | 36% | 29% |
| Oklahoma | 69% | 54% | 33% |
Corn, wheat, and soybean prices plunged at the end of March following a report by the USDA that indicated larger-than-expected U.S. stockpiles and increased planting intentions.7 If the planting season is uneventful and the summer weather is favorable, there is a possibility that the 2013 growing season will yield a record crop. This would mean increased downward pressure on the commodity prices (as of April 17, 2013, the December corn contract price is at $5.47, 8.5% below the approved planting price of $5.98).
If this trend continues, crop insurance and reinsurance companies may face underwriting losses from revenue-based MPCI policies (which account for the bulk of the program) that can trigger if yield does not increase to compensate for lower prices. This would be in contrast to 2012, when there was reduced yield but higher prices.
Conclusion
Although the 2012 growing season began on a very promising note, AIR modeled loss estimates indicated that, by November, the crop insurance industry was facing one of the worst losses since 1988. In a similar vein, while the start of the 2013 growing season looks promising now, we do not know what the final outcome will be. Ever-present weather risk and intra-seasonal commodity price volatility can reduce the profitability of an otherwise solid crop portfolio.
The AIR Agricultural Risk Modeling Team will continue to monitor the 2013 season closely and will issue monthly CropALERT production reports. For crop insurance and reinsurance companies that want to manage their risk proactively, seasonal portfolio loss monitoring services will be available beginning in August 2013.
1 http://www.ncdc.noaa.gov/billions/
2 http://research3.bus.wisc.edu/file.php/245/RMI_820_Fall_2010/Weather_insurance_articles/crop_insurance_reconsidered.pdf
3These low yields and the expected carryover shortage at harvest contributed to a significant commodity price increase. The final price increase for corn was 132% (from the approved price of $7.50 at harvest to the approved price of $5.68 at planting); the final price increase for soybeans was 124% ($15.39 at harvest and $12.55 at planting).
4 http://www3.rma.usda.gov/apps/sob/current_week/sobrpt2010-2013.pdf
5 http://www.claimsjournal.com/news/national/2013/03/25/225649.htm
6 http://www.nass.usda.gov/Publications/National_Crop_Progress/index.asp
7 http://www.bloomberg.com/news/2013-04-01/corn-extends-rout-to-lowest-since-july-on-u-s-reserves-outlook.html
8 If you would like additional information on AIR's crop models and services, please contact Oscar Vergara at overgara@air-worldwide.com.
