


Modeling Fundamentals: What Is AAL?
Mar 25, 2013
Editor's Note: This article explains the fundamentals behind the calculation of average annual loss (AAL). An upcoming article will address some common misperceptions and frequently asked questions.
AIR catastrophe model catalogs contain years of simulated activity that reflect our best scientific understanding of potential future events. A key model output is a fully probabilistic loss distribution, which is typically expressed as an exceedance probability (EP) curve. The mean of this distribution is the average annual loss (AAL), or the expected loss per year, averaged over many years. AAL is a loss statistic that is widely used and has a diverse range of applications in catastrophe risk management.
This article will explain how AAL is calculated and what it means for different perils. In an upcoming issue of AIR Currents, we'll address some frequently asked questions and common misperceptions about this important metric.
Year-Based Catalog Approach
AIR's constrained Monte Carlo simulation approach results in a catalog containing many thousands of years of simulated events that reflects how events actually happen in nature, with each year representing one realization of what an upcoming year of catastrophe activity might look like. Determining the average annual loss is thus a straightforward and intuitive process. It can be calculated on an occurrence (event) or aggregate (annual) basis at any level of geographic granularity—from a global, all-perils industry perspective, to a more detailed view like wind risk to a particular portfolio, all the way down to that of a single location and peril.
The first article of the AIR Currents Modeling Fundamentals series, Combining Loss Metrics, explains some of the basics behind AIR's stochastic catalog and how the exceedance probability curve is calculated. AAL is the expected value of the full exceedance probability distribution and the following, much simplified example illustrates this calculation conceptually.

By: Greg Sly, CCM and Nan Ma, CCM
Calculating Average Annual Loss
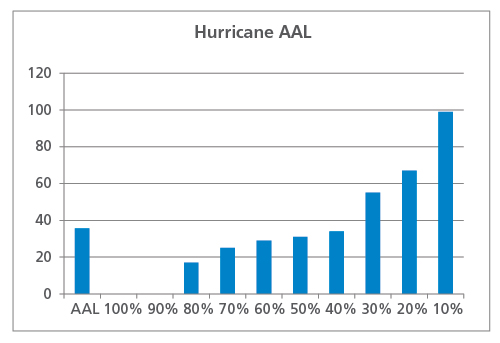
Suppose you wish to calculate the AAL for a geographically disperse portfolio of properties using a 10-year hurricane catalog (note that this is a contrived example for illustrative purposes only; actual catalogs typically contain 10,000, 50,000, or even 100,000 years of simulated activity). In each simulated year, there may be zero, one, or multiple hurricanes that impact the portfolio. Running the model against this portfolio in AIR software yields the losses shown in Table 1.
| Hurricane | |
|---|---|
| Simulation Year | Loss (USD millions) |
| 1 | 25 |
| 2 | 0 |
| 3 | 17 |
| 4 | 34 |
| 5 | 99 |
| 6 | 67 |
| 7 | 0 |
| 8 | 31 |
| 9 | 55 |
| 10 | 29 |
These losses are then ranked to produce an exceedance probability curve and also averaged to calculate the aggregate AAL, as shown in Figure 1. In this example, the AAL is USD 36 million. Notice that seven years cause lower losses than the AAL and three years cause higher losses. In two years, no hurricanes affected the portfolio, and losses were zero.
What AAL Does Not Reveal
Suppose that this same hypothetical portfolio of properties is situated near an earthquake fault that is expected to rupture once every five years. Running a 10-year earthquake catalog against the portfolio might yield the losses shown in Table 2.
| Earthquake | |
|---|---|
| Simulation Year | Loss (USD millions) |
| 1 | 0 |
| 2 | 0 |
| 3 | 250 |
| 4 | 0 |
| 5 | 0 |
| 6 | 0 |
| 7 | 0 |
| 8 | 0 |
| 9 | 150 |
| 10 | 0 |
The EP curve and AAL can be calculated as before, as shown in Figure 2. The earthquake AAL is very similar to that for hurricane, at USD 40 million, but it is immediately apparent that the risk profile from these two perils is very different.
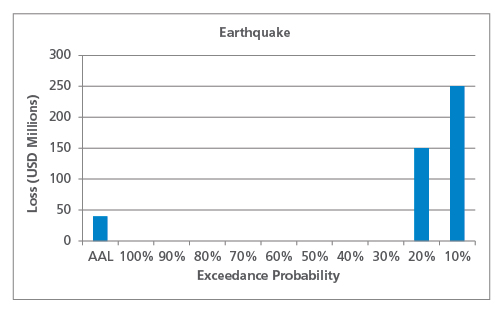
As this simplified example shows, for perils that are characterized by infrequent damaging events (like earthquakes), the low-frequency, high-impact tail end of the distribution will contribute more to the AAL than perils that exhibit a higher frequency of less damaging events. This is important to keep in mind when comparing the historical AAL (calculated based on a limited number of years) to the modeled AAL. For perils whose AAL is driven by the tail of the distribution, the historical AAL will likely be much lower than the modeled if a large event has not occurred within the time span of the recorded data.
Aggregate and Occurrence AAL
As previously mentioned, AAL can be determined on an aggregate or occurrence basis. Just as in nature, each year can have zero, one, or multiple damaging events, and aggregate AAL takes into consideration all loss-causing events in each simulated year. Losses from all events are added up and then divided by the number of the years in the catalog, as shown in the examples in the previous section.
Occurrence AAL, on the other hand, is based only on the largest loss in each simulated year, so if two identical losses occur within the same year, only one contributes toward the occurrence AAL. The following example explains the calculation conceptually. Note however that occurrence AAL does not provide a very meaningful view of risk; using the aggregate AAL is recommended.
Table 3 shows the same 10-year hurricane catalog, but this time broken down by event. The largest loss from each year is highlighted.
Table 3. Hypothetical 10-year hurricane catalog, broken down by event
| Hurricane | ||
|---|---|---|
| Simulation Year | Event Number | Loss (USD millions) |
| 1 | 1 | 25 |
| 2 | 0 | |
| 3 | 2 | 13 |
| 3 | 4 | |
| 4 | 4 | 27 |
| 5 | 7 | |
| 5 | 6 | 16 |
| 7 | 2 | |
| 8 | 49 | |
| 9 | 32 | |
| 6 | 10 | 43 |
| 11 | 11 | |
| 12 | 13 | |
| 7 | 0 | |
| 8 | 13 | 31 |
| 9 | 14 | 55 |
| 10 | 15 | 7 |
| 16 | 22 | |
Only considering the largest loss from each year, the occurrence EP curve and occurrence AAL is shown in Figure 3.
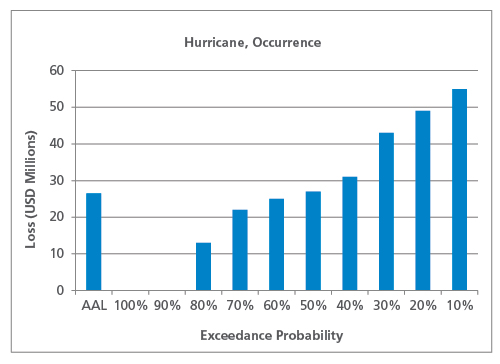
As expected, the occurrence AAL (at USD 26.5 million) is lower than the aggregate AAL. Once again, the nature of the peril affects the shape of the occurrence EP curve and the relationship between occurrence AAL and aggregate AAL. For lower frequency perils like earthquake, for example, it is less likely that multiple damaging events occur in the same year, so the occurrence AAL will be closer to the aggregate AAL than for higher frequency perils like severe thunderstorm.
Closing Thoughts
While the examples in this article have been much simplified for illustrative purposes, the basic point is that while the AAL is just a single number and is always calculated the same way, the distribution behind it can look very different depending on peril, region, and other hazard and vulnerability attributes. We'll explore the concept of EP curve shapes and its impact on AAL in more detail in an upcoming article, and we'll also address some frequently asked questions and misconceptions about AAL.
