


Fierce Winter Storm over Europe—Are You Prepared?
Dec 19, 2013
Event: Strong European extratropical cyclone
Model: AIR Extratropical Cyclone Model for Europe
Stochastic Event ID: 10742
Location: From southern England and northwestern France to the Baltic states
Storm footprint: About 2,100 km (1,300 miles) long and 1,045 km (650 miles) at its widest
Estimated insured loss: EUR 14.8 billion (USD 20.0 billion)
Annual exceedance probability: ~1% (100-year return period)
Event Overview
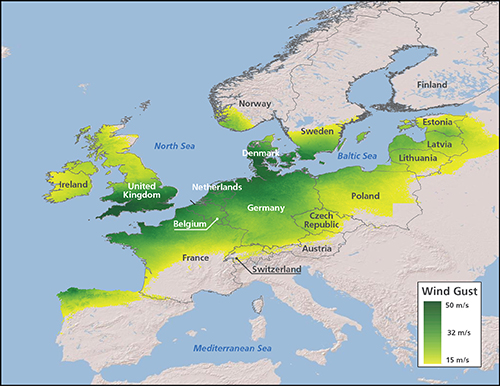
A powerful windstorm smashes into southern Britain before hitting northern France, the Netherlands, northern Germany, Denmark, and southern Sweden. It weakens as it continues to travel east, eventually dissipating over the Baltic states.
Damage across northern Europe is widespread. Wind gusts of more than 180 km/h (112 mph) topple trees, knock down power lines, flood lowlands, and disrupt land, sea, and air travel in some of Europe's most densely populated and heavily insured areas.
Residential buildings and older commercial properties are the worst affected, suffering damage to roof coverings, chimneys, cladding, and windows. As is typical with European winter storms, however, major structural damage is limited. Thus, the amount of each claim is modest, but the storm's large footprint results in more than 8 million claims across Europe.
AIR estimates that if such an event were actually to happen today, insured losses would be EUR 14.8 billion (USD 20.0 billion)1 across 16 countries. Figure 1 shows the wind intensity footprint for this simulated storm.

Each edition of this quarterly feature in AIR Currents presents a megadisaster scenario taken from an AIR model's stochastic catalog. Each scenario's loss has an annual exceedance probability of ~1% (a return period of ~100 years). The physical characteristics of the hypothetical event are described, exposures are identified, and the AIR model's estimate of insured losses are discussed.
By regularly presenting and discussing such entirely plausible high-impact events, these scenarios can help risk managers assess the possible impact to their portfolios and prepare for the unexpected.
Europe's Winter Storm Setting and History
European winter windstorms (also called extratropical cyclones, or ETCs) are frequent in northern and western Europe, and they can wreak havoc deep into eastern Europe as well. They usually form off the coast of Newfoundland when a warm subtropical air mass interacts with a cold polar one. ETCs derive their energy from the resulting temperature gradient. They are channeled across the Atlantic and as many as 70 can pass over Europe each year, but only five on average are capable of causing significant damage.
While European ETCs typically do not achieve the wind speeds of strong tropical cyclones, their size and ability to maintain their intensity for long distances over land can result in total losses similar to those of a catastrophic hurricane. In fact, European winter storms are the second highest cause of insured property losses in the world in terms of aggregate average annual losses, after U.S. hurricane. ETCs can also exhibit a phenomenon known as clustering, whereby several storms can impact a similar area within a short period of time. In 1999, one such cluster, comprising the storms Anatol, Lothar, and Martin, brought much of Europe to a halt. Together, the three storms resulted in millions of claims and caused insured losses of EUR 10 billion at the time.
The most destructive storm of the last 25 years was Daria, which struck the UK, France, the Netherlands, and Germany in January of 1990. Daria caused nearly 100 casualties and extensive property damage, and it remains the highest insured loss event for the UK. A recurrence of Daria today would cost insurers about EUR 10.5 billion (USD 14.2 billion).
| Event | Insured Loss | Insurable Loss |
|---|---|---|
| 1976 Capella | 4.6 | 4.8 |
| 1990 Daria | 10.4 | 11.3 |
| 1999 Lothar | 8.2 | 8.7 |
| 2007 Kyrill | 4.2 | 4.6 |
Note that insured losses are highly comparable to insurable losses, reflecting the high insurance penetration across all lines of business in Western Europe. Throughout the rest of the article, only insured losses will be reported.
Affected Exposure
Europe contains high concentrations of exposure in its densely populated major cities, which have some of the world's most expensive housing and commercial markets as well as priceless historical buildings and monuments. Germany, the United Kingdom, and France are the second, third, and fifth largest non-life insurance markets in the world by premium.
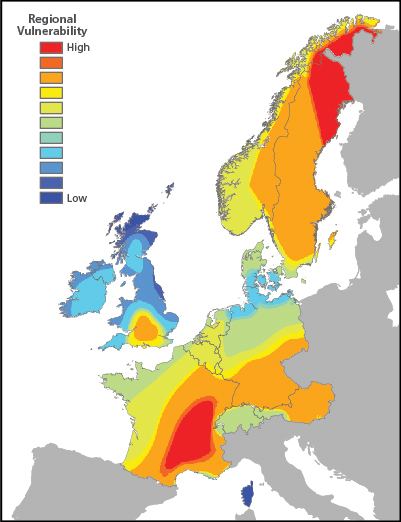
Europe experiences considerable diversity in storm climate, and each region develops building codes and construction practices in accordance with its historical storm experience. For example, the northern UK and Scandinavia, most frequently hit by intense wind- and snowstorms, generally exhibit durable construction and well enforced building codes. In regions that experience extreme winds relatively infrequently, like southeastern France and southern England, buildings tend to be more vulnerable. Design wind load requirements, as specified by a collection of structural codes known as Eurocodes, are based on gust speeds that have an annual exceedance probability of 2% for each region. However, construction quality and code enforcement varies widely. Figure 2 shows the relative wind vulnerability across Europe.
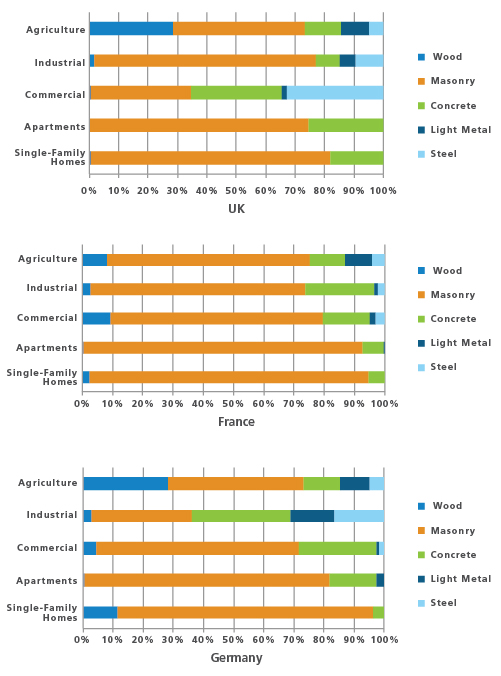
Structures in some of the hardest hit areas in the Megadisaster scenario—the southern UK, northern France, and northern Germany—are predominantly of masonry construction, which performs relatively well when exposed to heavy wind loads and wind-borne debris. Reinforced concrete, also a common construction type in the affected region, typically performs better than masonry. More vulnerable construction types include wood frame, which is used in some agricultural and residential buildings, and light metal, which accounts for 14% of Germany's industrial exposures.
The distribution of insurable property in the UK, France, and Germany by construction type and line of business is shown in Figure 3.
Throughout the affected region, damage to individual properties is generally of low to moderate severity and non-structural in nature; it is the widespread nature of the event that results in high aggregate losses. At the storm's wind speeds, widespread damage occurs to the outer building envelope of homes, including to roofs, chimneys, and sidings. Roof tiles and shingles are damaged or displaced, especially at the corners and edges.
In more serious cases, wind can penetrate underneath the roof covering and membrane, creating uplift, which can result in the partial or complete removal of the roof covering. This can compromise the structural integrity of the building and can lead to damage to contents from wind and precipitation. Agricultural buildings in Europe, which are generally subject to lower design standards, experience the highest damage ratios. Those with light metal roofs are especially vulnerable.
Commercial buildings (and mid- to high-rise apartment buildings and condos) are more likely to receive engineering attention and are thus less vulnerable than single-family homes. Still, roofs and siding experience damage from this simulated event, and the windows and external glass of high-rise structures are broken by wind-borne debris.
Extensive tree damage is expected from the high winds, which snap off large branches and topple shallow-rooted trees. Trees falling onto power lines and roads are the major cause of power and communication outages and disruption to surface travel. The storm also forces the closure of many airports, rail lines, and seaports. Falling trees also cause damage to buildings and autos.
Estimating the Impact
Figure 4 shows the distribution of modeled losses from this simulated scenario, which is largely consistent with the wind intensity footprint map shown in Figure 1.
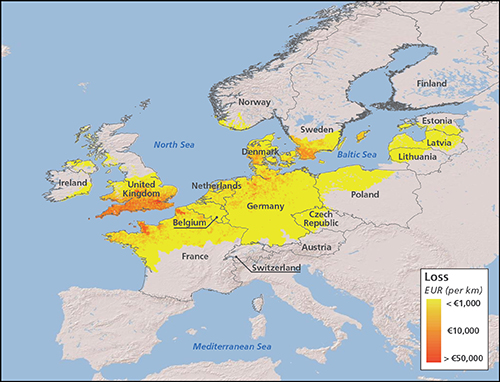
AIR estimates that this simulated event would cause insured losses in excess of EUR 14 billion, more than 80% of which occur in the UK, France, and Germany. Table 2 shows a breakdown of insured losses by country and line of business.
| Country | Residential | Commercial and Apartments/Condos | Industrial | Auto | Agriculture and Greenhouses | All LOBs |
|---|---|---|---|---|---|---|
*Unlike single-family or small multi-family houses, large apartment and condominium buildings frequently receive a degree of engineering attention similar to that given to commercial construction. **Poland, Czech Republic, Luxembourg, Latvia, Norway, Lithuania, Ireland, Estonia, and Switzerland. | ||||||
| United Kingdom | 4,479/6,047 | 1,106/1,493 | 746/1,008 | 198/267 | 303/409 | 6,833/9,224 |
| Germany | 1,091/1,473 | 978/1,320 | 647/874 | 70/95 | 201/272 | 2,989/4,035 |
| France | 959/1,294 | 531/717 | 412/556 | 38/51 | 177/240 | 2,116/2,857 |
| Netherlands | 633/854 | 285/385 | 189/255 | 44/59 | 68/92 | 1,219/1,645 |
| Denmark | 380/512 | 224/302 | 141/190 | 31/42 | 115/155 | 890/1,201 |
| Belgium | 198/267 | 81/109 | 95/128 | 12/16 | 23/31 | 408/551 |
| Sweden | 163/220 | 71/96 | 34/46 | 7/9 | 42/57 | 316/427 |
| Other Countries** | 5/7 | 10/14 | 15/20 | 0/0 | 16/21 | 47/63 |
| Total | 7,907 | 3,286 | 2,279 | 400 | 945 | 14,817/20,003 |
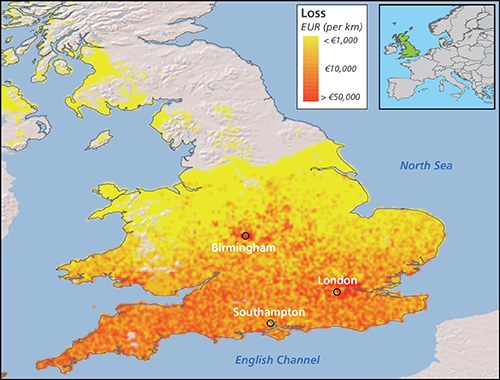
Losses in the UK, at EUR 6.8 billion, make up more than 45% of the total insured loss for this event. As Figure 5 shows, most of the losses are distributed across the southern UK. More than half the total, EUR 4.5 billion, results from losses to residential homes, with a high concentration of losses in London, Birmingham, around the Bristol Channel in cities like Bristol and Cardiff (in Wales), and along the southern coast in cities like Southampton, Plymouth, and Brighton. Commercial and industrial losses total another EUR 1.9 billion and are highly concentrated in London and Bristol. Bristol, a major seaport and manufacturing hub for the aerospace and electronics industries, suffers particularly high losses to industrial assets.
France and northern Germany also experience high losses, totaling about EUR 2 billion and 3 billion, respectively. In France, high losses to homes occur in the departments of Pas-de-Calais, Manche, Nord, and Seine-Maritime along the northern coast. In Germany, high residential losses occur in the northern cities of Hamburg, Bremerhaven, Flensburg, Kiel, Emden, Oldenburg, and Elmshorn. Commercial and industrial losses are heavily concentrated around Hamburg, Hannover, Flensburg, and Kiel.
The highest losses to agricultural properties occur in Manche, France, a predominantly rural department in Lower Normandy with flat prairie farmlands; Skane County at the southern tip of Sweden, which is the country's most productive region for crops; and southern Jutland peninsula in Denmark.
Are You Prepared?
Using model scenarios to probe your portfolio's strengths and weaknesses is responsible risk management practice. It is important to prepare for a wide range of scenarios in order to respond effectively when disaster does strike. This scenario is just one example of the extensive and widespread damage an extratropical cyclone could produce in Europe. Its loss has a modeled annual exceedance probability of about 1% (roughly a 100-year return period loss). This is not an extreme tail event; far greater losses are possible.
A few modeling best practices can help ensure that your model produces the most realistic loss estimates.
- Building response to potentially damaging winds is highly dependent on its location and attributes. Accordingly, collect accurate, detailed information for the properties that make up your portfolio—including location and all primary building characteristics like construction type, occupancy, building age, height—and a true replacement value. Relying solely on coarse resolution address data can lead to significant over-or underestimations of risk.
- Be aware of nonmodeled sources of potential loss. Not discussed in this scenario, for example, is damage attributable to business interruption, inland flooding, coastal surge, sewer backups, and snow or ice.
- Note the terms of your re/insurance treaty, including how the "hours clause" applies to a storm that affects a large areas over multiple days, or to multiple storms that hit the same area within the time window. For example, commercial policyholders may have multiple facilities affected on different days from a single storm, and insurers need to decide when to commence the qualified period for reinsurance recoveries.
- Finally, consider your loss ratio, or how your estimated losses compare to the "total insured value" in each affected area. While your losses may at first appear to be high, the loss ratio they reflect (typically less than 15% even in the worst affected region of this Megadisaster analysis) should be entirely consistent with an infrequent but thoroughly plausible catastrophic event.
Closing Comments
What will be the next megadisaster surprise?
AIR's models capture the behavior of physical phenomena and how those phenomena impact the built environment. They have been thoroughly validated using data from a wide variety of sources.
But no model can predict what the next mega-catastrophe actually will be or when it will occur. This fundamental uncertainty makes it all the more important for companies to use catastrophe models to prepare for such losses. The full range of scenarios the models generate—simulating so many perils that impact so many places—provide a unique and important global perspective on an organization's overall risk. The careful analysis of model results can help risk managers prepare for many contingencies—thus ensuring that scenarios like the one presented here will not be entirely unexpected.
1 All USD amounts are based on an exchange rate of EUR 1 = USD 1.35, current in mid-December 2013.
