


Earthquake Risk in Japan After Tohoku: Updates to the AIR Model
Jan 24, 2013
Editor's Note: AIR is releasing a major update to the AIR Earthquake Model for Japan in the summer of 2013. This article provides an overview of some of the most significant changes, many of which will be examined in greater detail in future articles.
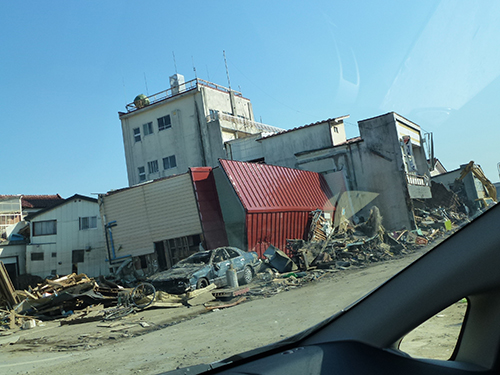
The potential for damage due to earthquakes at a given site is associated with considerable uncertainty, even in a country like Japan, which has one of the longest and most well-studied earthquake records in the world. Despite its high building standards and intensive preparation drills, Japan was caught off-guard by the destruction caused by the M9.0 earthquake that struck offshore of Tohoku on March 11, 2011.
The devastation from the Tohoku event, particularly in areas inundated by the tsunami, has prompted an urgent re-examination of existing earthquake models for Japan. The seismological community at large had not anticipated an event of that size in the affected area, and the rupture had important implications for future risk on nearby faults. Since then, AIR has been carefully reviewing the research conducted by government agencies, such as Japan's Headquarters for Earthquake Research Promotion (HERP), and consulting with scientists involved in this research. These studies are being used by AIR to develop a comprehensive and up-to-date view of earthquake risk, along with realistic probabilities of earthquakes' associated perils, tsunami and liquefaction.
In the summer of 2013, AIR is releasing a significant update to the Japan earthquake model that will incorporate these latest findings. The update benefits from the abundance of both scientific and detailed insurance claims data that the Tohoku event generated, which have provided extremely valuable insight into the impact of a great earthquake on all lines of business. AIR's updated earthquake model for Japan makes extensive use of these data to develop the model's new capabilities and to validate all model components.
This article presents a high level overview of the most significant changes. Subsequent articles will provide additional detail about individual enhancements.
Reassessing Japan's Seismicity
The Tohoku earthquake demonstrated that we cannot rely solely on past data when evaluating risk from great earthquakes, even in a country with a long history of recorded earthquakes like Japan. The 2007 National Seismic Hazard Maps from HERP, which informed AIR's previous version of the model, depended largely on historical data to formulate the seismicity of the subduction zones. Consequently, the lack of great historical earthquakes on the segment of the Japan Trench where the Tohoku earthquake occurred was taken to indicate low seismic coupling.1 Accordingly, only earthquakes of moderate size were considered for this region, and the Tohoku earthquake caught most seismologists by surprise. In light of Tohoku, AIR researchers undertook a broad range of studies to better understand the seismotectonics of Japan.

By: Dr. Tao Lai and Ann Weiner
Edited by Nan Ma
The article: Provides a high level overview of some of the most significant changes in the forthcoming update to the AIR Earthquake Model for Japan, scheduled for release in June 2013.
Highlights: In light of the Tohoku earthquake, AIR has undertaken a comprehensive reassessment of Japan's seismicity. The updated model incorporates new findings on earthquake occurrence and includes explicit modeling of tsunami and liquefaction risk.
A New Understanding of the Hazard
AIR's updated model reflects new findings and updated rupture probabilities that will complement HERP's National seismic Hazard Maps. The Tohoku earthquake has had significant implications for the seismic source zones of the Japan Trench, increasing the probability of rupture on some segments and lessening it on others.
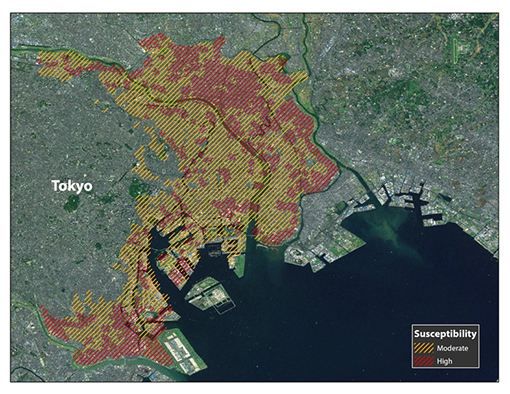
The event has also raised the question of whether a similarly unexpected event could occur elsewhere on the Japan Trench. For example, the area south of Tohoku rupture zone, near the Boso Peninsula, did not rupture during Tohoku and has not produced any large earthquakes in recorded history. In fact, the 2007 HERP model did not consider large magnitude earthquakes on this segment. However, the Tohoku earthquake suggests that this is no guarantee that a large earthquake cannot occur here in the future. Understanding and accounting for earthquake risk on this segment is very important, especially considering its proximity to Tokyo and a number of other large metropolitan areas. AIR researchers have therefore modeled a separate subduction segment for the area around the Boso Peninsula, which they refer to as the Boso segment. Although the uncertainty is high, it is possible that this area may have accumulated enough energy to generate a major event with a magnitude of 8.0-8.5. An event of this type could severely impact Tokyo.
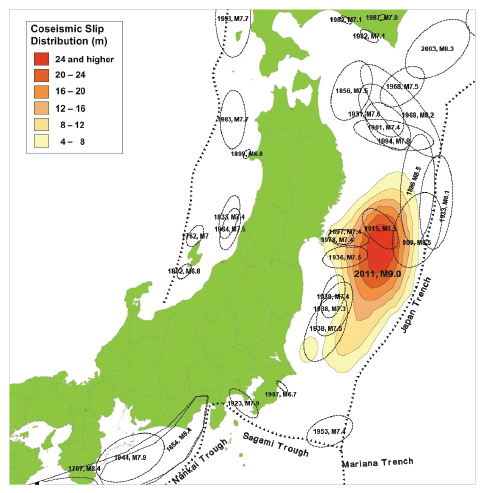
Stress Transfer
AIR scientists also conducted original research to evaluate the impact of the Tohoku earthquake on crustal faults and on seismic source zones outside those affected by the Tohoku event, including the Kanto Plain, the Nankai Trough, and the Sagami Trough (Figure 1). They analyzed changes in Coulomb failure stress2 in light of observed changes in the rate of seismicity in different regions to identify and model areas most affected by the Tohoku earthquake. AIR's study indicates some increase in the state of stress on the interface of the Pacific plate under Kanto Plain of Japan, which contains some of the country's most populous cities, including Tokyo.
Improved Understanding of Fault Geometry
Another important enhancement to the AIR model is a more detailed and precise understanding of fault geometry, particularly for the Nankai subduction zone. Japan's government has recently developed earthquake scenarios for this complex subduction area that take into consideration the latest research regarding the geometry of the plates. Several studies indicate that, near central Japan, the Pacific Plate is subducting at a more gradual angle than previously thought, effectively bringing earthquake events closer to the surface and thus increasing their intensity. This is supported by geophysical studies that suggest an extra fragment of plate appears to be lodged above the Pacific Plate under the Kanto Plain region, separating it from the Philippine Sea and Okhotsk Plates.
The Industry's First Fully Probabilistic Numerical Tsunami Model
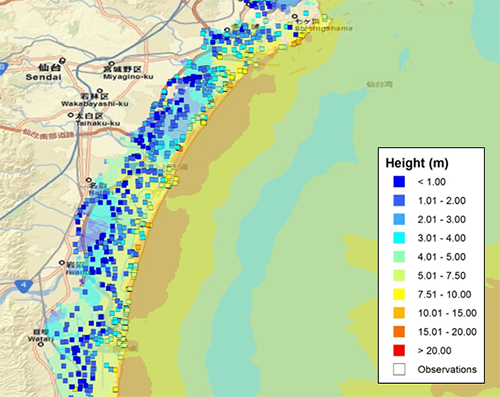
The Tohoku event has had an enormous impact on the awareness of tsunami risk in Japan. While Japan is no stranger to tsunamis, those on the scale of the Tohoku event are rare. The Tohoku tsunami easily overtopped Japan's manmade levees in many coastal areas, with tragic results, and has highlighted the need to model such tsunami events to understand their future likelihood and possible impact. AIR is thus introducing the industry's first fully probabilistic tsunami model. Offering more than just deterministic scenarios or inundations footprints, AIR's model explicitly captures tsunami occurrence, intensity, and damage.
To model the tsunami (and seismic) risk, AIR used GPS data to evaluate the state of coupling for the Nankai Trough and Japan Trench, which are the most likely locations of future earthquakes that could generate the large amount of slip associated with damaging tsunamis.
Once a simulated earthquake generates a tsunami, the entire life of the tsunami is modeled, from fault rupture, to the tsunami's propagation across the sea, and throughout its entire inundation period. This simulation is based on the laws of physics that govern the motion of a fluid. For each event in the catalog capable of generating a tsunami, the two major damage determinants—tsunami height and forward speed—are modeled based on the characteristics of the originating earthquake, the bathymetry of the ocean, and overland surface features. The approach accommodates the non-uniform nature of earthquake slip to provide a realistic simulation that allows variations in a tsunami's height and speed at different inundation points.
A tsunami's height and speed are greatly affected by the friction it encounters along the floor of the ocean and on land. This friction increases as the wave approaches shallow water near the coastline and then over land. In the AIR model, land cover data was used to specify the friction characteristics and their effects on the tsunami. High resolution (50m) terrain and coastline data were used to enhance onshore terrain heights and the depths of waterways, harbors, and ports. The AIR model also takes into account Japan's extensive defense system, including in all simulations the probabilistic failure of a levee due to the hydrodynamic force of the wave. Therefore, even if a levee is not overtopped by a tsunami, the model includes any additional damage caused by a levee breach.
In the updated model, explicit tsunami damage estimates include both property damage and injury estimates. Property damage estimates incorporate the effects of debris impact as well as the force of the water. The personal injury line of business takes into account factors that impact the number of claims, such as the time of day and the time it takes the tsunami to arrive.
Modeling Liquefaction
Although eclipsed by the tsunami and shake damage, the liquefaction damage produced by the Tohoku event was severe. When an area saturated with groundwater experiences heavy ground shaking, the water pressure in the soil can cause it to lose its stiffness and behave like a heavy liquid. When this happens, the soil loses its capability to support structures, which can then tilt or sink even if they remain structurally intact. Widespread areas of the Kanto Plain, especially around Tokyo Bay and along the Tone River, exhibited deformed streets, sidewalks, and train tracks, as well as damage to underground pipes.
AIR's liquefaction module incorporates many recent studies on the surface geology, geomorphology, and shear wave velocity for regions that are prone to liquefaction. AIR researchers obtained groundwater data along with the borehole database of Japan from several sources including Japan's Ministry of Land, Infrastructure, Transportation, and Tourism (MLIT). The liquefaction settlement estimation follows the FL method, established by Japan Road Association in 2002, which is now widely used in many studies, including many of the earthquake scenarios provided by Japan's government. The liquefaction damage estimation leverages Japan government recommendation as well as findings from the Christchurch, New Zealand earthquake.
Closing Thoughts
AIR understands the critical need for reliable risk assessments that include scenarios of a Tohoku-like event near the Kanto Plain. With the update to the AIR Earthquake Model for Japan, AIR is providing companies with a model that addresses the recent and dramatic changes to Japan's seismic risk landscape, as well as the need to explicitly model associated perils like tsunami and liquefaction.
Included in the updated model are damage functions for new construction classes, including large industrial facilities. These damage functions have been validated against an unprecedented amount of detailed claims data from the Tohoku earthquake. The fire damage module is also being updated with a major enhancement to the methodology used to determine fire outbreaks. It features a newly-developed algorithm for determining fire spread, which leverages an updated high-resolution industry exposure database.
While it is still too early to specify exactly how AIR-modeled loss estimates will change as a result of incorporating the new science and engineering, in the end, companies will benefit from a more realistic and comprehensive view of the risk.
1 Seismic coupling refers to the degree to which two sides of a fault are locked and accumulating stress.
2 Coulomb failure stress is the stress that is produced from opposing forces, such as tectonic plates pushing against one another. It is typically measured in "bars" where a bar is roughly equivalent to the atmospheric pressure at sea level.
