


The Pressure’s On: Increased Realism in Tropical Cyclone Wind Speeds through Attention to Environmental Pressure
Jan 20, 2012
Because the Earth has a tilted axis and rotates, the sun differentially heats the surface. This results in thermal imbalances—and therefore pressure imbalances (all else equal, the warmer the air, the lower the pressure)—between the equator and the poles. The atmosphere attempts to equalize these imbalances through wind. The strength of the wind is proportional to the strength of the pressure gradient; the more severe the gradient, the stronger the wind.
Tropical cyclones operate in much the same way, if on a much smaller scale. The difference between the higher atmospheric pressure outside the storm (the environmental pressure) and the lower pressure at the storm's center (central pressure) causes air to flow from the periphery to the eye—that is, from higher to lower pressure zones. The bigger the difference—termed the pressure deficit—the stronger the winds; that is, the more intense the storm.
This suggests that it is not only low central pressure that translates to strong winds, it is also high peripheral pressure. Indeed, the typical formula that relates maximum wind speed to pressure takes the form:

By: Jason Butke
Edited by Meagan Phelan
The article: discusses the need to account for basin-specific environmental pressure values when estimating tropical cyclone wind speeds. Failure to do so can result in over- or under-estimation of wind speed—and therefore losses.
Highlights: AIR's typhoon and hurricane models account for environmental pressure specific to basins throughout the world. In doing so, they provide the most reliable estimates of wind speed and damage in the industry.
Here, Vmax is the maximum wind speed; the term in parentheses is the pressure deficit, where PEnv is the environmental pressure (in millibars) and Pc is the central pressure (also in mb); C and n are empirical constants.
Interestingly, central pressure—whether estimated from satellite measurements, reconnaissance flights or direct observation—is a more reliable measure of tropical cyclone intensity than direct estimates of wind speed because both the number and magnitude of potential errors when measuring central pressure are lower (see sidebar, Wind Speed is Hard to Measure).
Wind-pressure relationships like the one above are used in real time, particularly in basins like the Pacific and Indian where reconnaissance data is sparse. But they are also used in many parametric catastrophe models, including the AIR tropical cyclone models. Their accuracy and realism are therefore of critical importance.
The concept of pressure deficits causing wind has long been understood. But while the measurement of central pressure is relatively straightforward, new efforts are being made to objectively measure environmental pressure. Several different definitions are shown in Table 1.
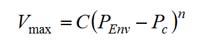
The first three—those of Wang, Holland, and Courtney and Knaff—are based on the sea level pressure at a storm's outermost closed isobar (OCI), or lines of equal pressure as shown in dark red in Figure 1. These rely on synoptic weather maps, the limitations of which are discussed in the next section. In contrast, Knaff and Zehr define environmental pressure as the average sea level pressure at a fixed distance from the storm center.
| Wang (1987) | Holland (1980) | Courtney and Knaff (2009) | Knaff and Zehr (2007) |
|---|---|---|---|
| OCI | 1st isobar beyond OCI | OCI + 2mb | 800-1000 km from storm center |
*Note that Wang defines PEnv as the outermost closed isobar (OCI) at the 1 mb contour interval. However, synoptic maps typically have a 4 mb contour interval, yielding a 3 mb uncertainty in determining PEnv from available maps. Thus, if the OCI as read on the synoptic map is 1004 mb, PEnv according to Wang is 1004-1007 mb.
Synoptic Weather Maps
Synoptic weather maps detail the current weather at the regional scale. Given a quick look at a synoptic weather map, a meteorologist could identify the OCI, thereby determining the environmental pressure. In the synoptic map for Hurricane Gustav (2008) shown in Figure 1, the outermost closed isobar is 1004 millibars. Using Wang's definition, this translates to an environmental pressure of 1004 to 1007 mb (see note to Table 1), while it translates to 1008 mb using the Holland definition, and to 1006 mb using that from Courtney and Knaff.
In the context of a wind-pressure relationship and, in turn, in the context of a catastrophe model's damage estimates, such differences can lead to very different results, as we explain later.
Reanalysis Data
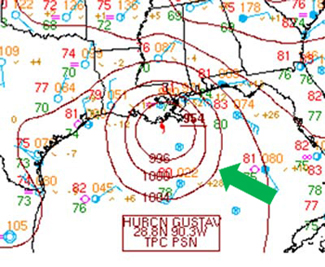
Recently, scientists have proposed alternative ways to quantify environmental pressure using reanalysis data—which is the output from a numerical weather prediction model that assimilates observational storm data every six hours. Global reanalysis data allows them to analyze this variable for large numbers of storms across basins. Such a process, which does not rely on the availability of synoptic weather maps, is ideal for building tropical cyclone climatologies used in catastrophe models. Examples are shown in Figure 2. While the resolution of the reanalysis data is not sufficiently high to represent the true central pressure of topical cyclones, it is sufficient for analyzing environmental pressure.
Following Knaff and Zehr's method, AIR analyzed global reanalysis data from the NCEP/NCAR Reanalysis Project (NNRP), which spans more than sixty years. (By comparison, Knaff and Zehr analyzed just fifteen years, beginning in 1989). Specifically, AIR calculated the average sea level pressure at various fixed distances from the storm center. This was done for all 6-hourly storm centers in the six ocean basins that generate tropical cyclones.
Results using Knaff and Zehr's methodology are provided in the right-most column of Table 2 for a select set of U.S. landfalling hurricanes. Also shown are results from an analysis of synoptic maps using the formulations of Wang, Holland, and Courtney and Knaff. The results from the Knaff and Zehr-based strategy are generally higher than the results based on synoptic maps. This may indicate that the fixed distance of 800 to 1000 km from storm center may be too large—at least for some basins.
| Method Used | ||||||
|---|---|---|---|---|---|---|
| Storm | Year | Time | Wang | Holland | Courtney and Knaff | Knaff and Zehr |
| Bob | 1985 | July 25 06z | 1012-1015 | 1016 | 1014 | 1017 |
| Opal | 1995 | Oct 05 00z | 1000-1003 | 1004 | 1002 | 1005 |
| Isabel | 2003 | Sept 18 18z | 1012-1015 | 1016 | 1014 | 1019 |
| Wilma | 2005 | Oct 24 06z | 1004-1007 | 1008 | 1006 | 1010 |
| Humberto | 2007 | Sept 13 00z | 1012-1015 | 1016 | 1014 | 1014 |
| Dolly | 2008 | July 24 00z | 1004-1007 | 1008 | 1006 | 1011 |
| Gustav | 2008 | Sept 01 12z | 1004-1007 | 1008 | 1006 | 1008 |
| Ike | 2008 | Sept 13 06z | 1004-1007 | 1008 | 1006 | 1008 |
Indeed Table 3 shows that environmental pressure as calculated according to knaff and Zehr does vary by ocean basin.
Table 3. Average environmental pressure values, by ocean basin, calculated by AIR using the published method by Knaff and Zehr (2007)
| Basin | PEnv |
|---|---|
| North Atlantic | 1014.1 |
| Northwest Pacific | 1008.3 |
| South Pacific | 1008.1 |
| North Indian | 1006.5 |
| South Indian | 1010.6 |
| East Pacific | 1008.8 |
The Impact of Variable Storm Size on Environmental Pressure
Although the distance from the center of any storm to the outer closed isobar varies over its lifetime, using the fixed distance approach is preferred to the synoptic weather map technique; synoptic maps may not be readily available for all regions or over sufficiently long time periods. Additionally, without a fixed distance, standardized comparisons of environmental pressure from basin to basin are not possible.
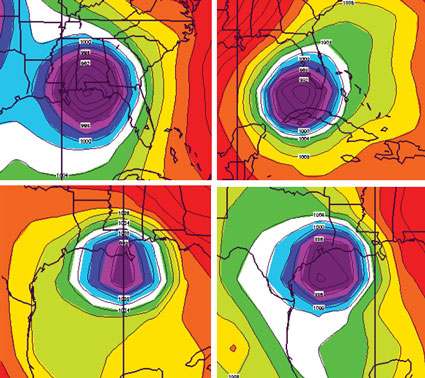
Nevertheless, although Knaff and Zehr advocate the use of 800 to 1000 km from storm center to determine environmental pressure, this may not be appropriate for all basins as was noted before. In particular, such a distance may be too large for ocean basins in which storms are smaller. Work from Chavas and Emanuel (2010) shows that tropical cyclones in the Northwest Pacific are, on average, larger than storms in any other basin. Indeed, they are approximately 25% larger than North Atlantic storms (Figure 3).
Similarly, analyses of storms in the Northwest Pacific and North Atlantic basins demonstrate that the radius of gale and storm-force winds are 82% and 13% larger, respectively in the Northwest Pacific (Japan Meteorological Agency and Demuth et al., 2006). Because techniques vary between these datasets, there is uncertainty in the results. Nonetheless, they do independently confirm that the fixed distance strategy should vary by basin. In short, the tendency for storm size to vary by basin must be accounted for in order to accurately determine the environmental pressure variable for use in a wind-pressure relationship.
The Impact of Latitude on Environmental Pressure
Environmental pressure is also contingent on latitude; higher latitudes are generally characterized by colder temperatures and thus higher environmental values (Figure 4).
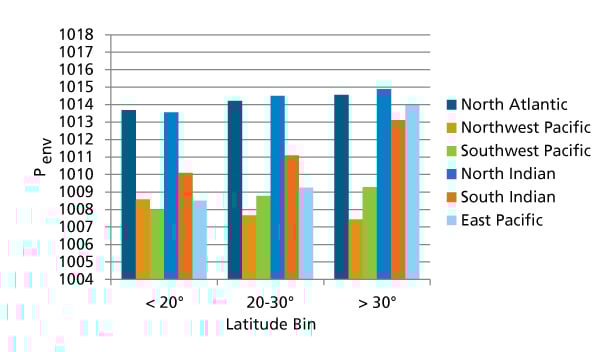
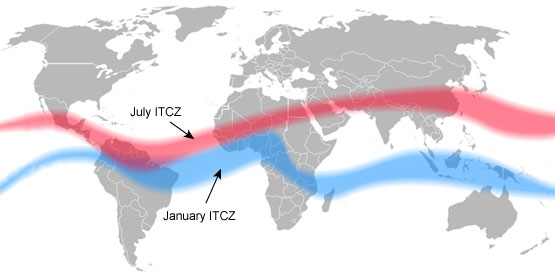
The Northwest Pacific is an exception. The negative correlation between latitude and environmental pressure here may be caused by the basin's proximity to the InterTropical Convergence Zone (ITCZ), a region of low pressure that moves north in the summer months and south during the winter (Figure 5). Storms that form or track near the ITCZ have lower environmental pressures than storms that form or track farther away. Because storm genesis in the Northwest Pacific continues to occur throughout the winter months—an inactive period in most other basins—it occurs farther from the ITCZ. This, and the fact that colder months are characterized by higher environmental pressure generally, (see callout on Seasonality), may drive the higher environmental pressure values in the Northwest Pacific even at low latitudes.
The Importance of Environmental Pressure in Catastrophe Modeling
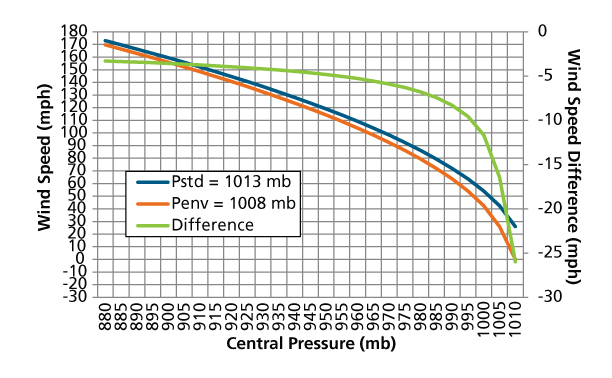
Because environmental pressure changes with basin-specific factors like those discussed above, it is important to identify basin-specific wind-pressure relationships for use in catastrophe models. Changes of even a few millibars in estimates of environmental pressure can have a significant impact on the accuracy of wind speed estimates for a particular basin, especially considering that the wind speed-damage relationship is quasi-exponential.
Consider the simplest case of creating a basin-specific tropical cyclone model with a basin-specific environmental pressure value of 1008 millibars versus using the standard global average atmospheric pressure of 1013 millibars. Using a wind-pressure relationship of the form Vmax = C(PEnv — Pc)n, where n is set to 0.5 and C is arbitrarily set to 15.0, it is evident that the largest differences in wind speed associated with using one environmental pressure value versus the other would result for weaker storms (those with lower wind speeds). This is because at lower wind speeds, central pressure is higher and thus closer to the PEnv value; any incremental change in PEnv at this stage can have a large impact on the pressure deficit. The impact diminishes for more intense storms (where central pressure is lower) because the relative change in the pressure deficit diminishes.
By utilizing basin-specific environmental pressures in wind-pressure relationships, the AIR tropical cyclone models ensure reliable estimates of tropical cyclone wind speeds—and therefore reliable estimates of loss.
In the case of historical events, using storm-specific values is a better practice than assuming a basin mean value. And it should be noted that in analyzing—and estimating losses for—events in real time, utilizing synoptic weather maps is the clearly preferred approach.
Footnotes
1 In reality, the relationship between central pressure and maximum wind speed is a function of storm motion, latitude, size, intensification trend, and environmental pressure, all of which vary in time and by event (Knaff and Zehr, 2007). As a result, the mean relationship between central pressure and maximum wind speed results in considerable scatter for any given wind-pressure relationship.
References
Chavas, D.R. and K.A. Emanuel, 2010: A QuikSCAT climatology of tropical cyclone size. Geophysical Research Letters, 37, L18816, do1:10.1029/2010GL044558.
Courtney, J. and J.A. Knaff, 2009: Adapting the Knaff and Zehr wind-pressure relationship for operational use in tropical cyclone warning centres. Australian Meteorological and Oceanographic Journal, 58, 167-179.
Demuth, J., M. DeMaria, and J.A. Knaff, 2006: Improvement of advanced microwave sounder unit tropical cyclone intensity and size estimation algorithms. Journal of Applied Meteorology, 45, 1573-1581.
Holland, G., 1980: An analytical model of the wind and pressure profiles in hurricanes. Monthly Weather Review, 108, 1212-1218.
Knaff, J. A., and R. M. Zehr, 2007: Reexamination of tropical cyclone pressure—wind relationships. Weather Forecasting, 22, 71—88.
RSMC La Reunion: Tropical cyclone best track data set. [Available online at ftp://eclipse.ncdc.noaa.gov/pub/ibtracs/original-bt-data-files/reunion/WMO-Best-Tracks.txt].
RSMC Miami (HURDAT): Tropical cyclone best track data set. [Available online at http://www.aoml.noaa.gov/hrd/hurdat/tracks1851to2010_atl_reanal.html].
RSMC New Delhi (IMD): Tropical cyclone best track data set. [Available online at ftp://eclipse.ncdc.noaa.gov/pub/ibtracs/original-bt-data-files/newdelhi].
RSMC Tokyo (JMA): Tropical cyclone best track data set. [Available online at http://www.jma.go.jp/jma/jma-eng/jma-center/rsmc-hp-pub-eg/Besttracks/bst_all.txt].
