


The 2012 Hurricane Season in Perspective
Dec 20, 2012
Editor's Note: The 2012 Atlantic hurricane season exceeded expectations and proved to be extraordinary in several respects. In this review, AIR Principal Scientist Tim Doggett evaluates this season's activity, including the unique features of Hurricane Sandy.
Another Active Year
Pretty much every way you look at it, 2012 was a year of above-average activity in the Atlantic Basin. For the third year in a row, nineteen named storms formed, and 2012 is now tied with 2010 and 2011 for the third most active season on record. With an annual total accumulated cyclone energy (ACE) of 123, tropical cyclone activity in 2012 was about 30 percent higher than the 1981-2010 average.
Ten of these named storms intensified into hurricanes, which is 60% higher than the number of hurricanes expected in a "typical" season (although the rate of intensification was near average). According to long-term seasonal averages, around 11 tropical storms are expected to develop in the basin. Of these, approximately six are expected to strengthen into hurricanes (with two to three of these becoming major, Category 3 or higher, storms) and between one and two are expected to strike the United States.

By: Dr. Tim Doggett
Edited by Jonathan Kinghorn
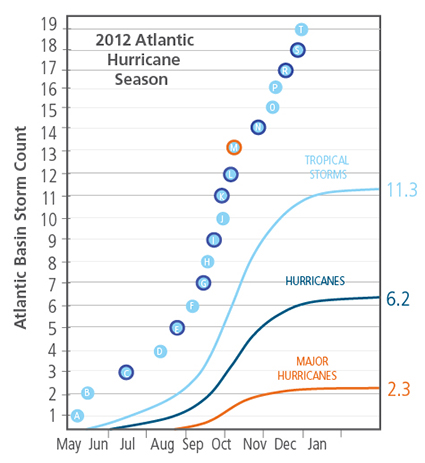
Interestingly, despite the high basinwide activity, only one storm this year (Hurricane Michael) developed into a major hurricane, and that was just for a single six-hour period. Additionally, much of the year's activity remained out in the open Atlantic, and in line with the long-term average, two hurricanes impacted the United States.
In the end, 2012 will most likely be remembered for Sandy, a hurricane that had begun to lose it tropical characteristics by the time it impacted the northeastern U.S. in the last days of October. It will also act as an important reminder that dangerous hurricanes come in a wide variety of shapes and sizes.
Off to a Flying Start
The season began early and energetically. For the first time since 1908, two tropical cyclones formed before June 1, the "official start" of the season, and a total of four storms had been named before June was out. Tropical Storm Beryl, which struck Florida on May 28, produced maximum sustained winds of 70 mph and is the strongest recorded tropical cyclone to make a preseason U.S. landfall. But these early season systems formed near the U.S. mainland and did not have sufficient time to develop into significant storms. After the fast start, the Atlantic basin calmed down in July, which is often a quiet period for tropical cyclone development. Not one tropical cyclone formed during this month.
Peak Season
Activity picked up again in August—dramatically. Eight named storms developed, tying August 2004 for the record of most named storms formed in that peak-season month. During the second half of the season, the main driver of tropical systems is the flow of disturbances from Africa over waters heated to their seasonal maximum. This phase often produces powerful, long-tracking hurricanes. Category 1 Ernesto, which drenched the Yucatan Peninsula in August, was one such event and Hurricane Isaac was another.
Isaac passed over Hispaniola and Cuba as a strong tropical storm and then struck the mouth of the Mississippi on August 28 as a Category 1 hurricane, almost exactly seven years after Hurricane Katrina devastated New Orleans. Fortunately, the city's rebuilt levee and pump station system, designed to cope with a storm greater than Katrina, did its job.
Isaac wobbled westward and made a second landfall in Louisiana before heading inland. Its unusually slow progress and great size—it was more than 350 miles wide—resulted in an extremely large damage footprint and excessive rainfall accumulations (up to 20" in some locations). A storm surge of 8-10 feet (notable for a Category 1 storm) also resulted in extensive flooding in exposed coastal locations. Isaac brought badly needed precipitation to parts of the drought-stricken Midwest, but it also caused nearly USD 1 billion in insured losses.
In September, four hurricanes were active in the open Atlantic. Michael became the most powerful storm of the year, but sustained Category 3 strength for only a few hours. The season's most prolonged tropical storm, Nadine, developed on September 12, floundered about aimlessly, and finally weakened below tropical storm strength on October 4. It is the fifth longest-lasting tropical cyclone on record (22 days).
Ending with a Bang
For the second year in a row (after 2011's Hurricane Irene), we were reminded of the often overlooked hurricane risk to the Northeast. On October 22, Sandy developed in the western Caribbean, which is a typical genesis region for late season tropical cyclones. It was upgraded to a Category 1 hurricane shortly before crossing Jamaica on October 25 and had grown in size and intensity by the time it struck Cuba three days later as a strong Category 2 storm. It then became disorganized and turned northwards. As Sandy tracked along warm Gulf Stream waters, the storm strengthened again as it moved northward off of the eastern seaboard. Finally, on October 29 the steering currents began to change. A strong high-pressure system located near Greenland blocked the flow to the north. At the same time a developing disturbance in the jet stream over the Ohio Valley began to draw the storm to the west. Ultimately Sandy's track abruptly shifted to the left, bringing the storm onshore along the New Jersey coast.
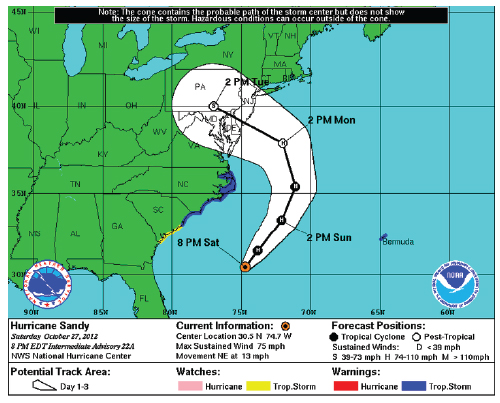
These shifts in atmospheric condition also led to changes in the storm's structure. While the core of the storm maintained many of its tropical attributes, the periphery of the wind field began to broaden and become more characteristic of a mid-latitude system. Because of this, NHC relabeled Sandy as a post-tropical cyclone of hurricane intensity just prior to landfall.
After landfall, Sandy converged with a cold front associated with the developing system coming out of the west, which led to a full transition of the system into an extratropical storm. The remnants of Sandy then deposited copious amounts of rain in areas along and south of the storm track, as well as dumping heavy snow in West Virginia and other mountainous regions. As a hybrid storm, Sandy was record-breaking in size, with a radius of tropical storm-force winds estimated at nearly 950 miles while it was still over the waters of the Atlantic. It was nearly twice the size of other massive hurricanes such as Katrina (2005) and Isaac (2012).
Hours before landfall, the system's minimum central pressure was measured at 940 millibars, the lowest ever recorded in a hurricane north of North Carolina and six millibars lower than the 1938 Long Island Express. Such a central pressure would usually be associated with a hurricane of much higher wind speeds, but Sandy's enormous size gave it a more gradual gradient between the eye and the outer bands and mitigated the intensity of the winds.
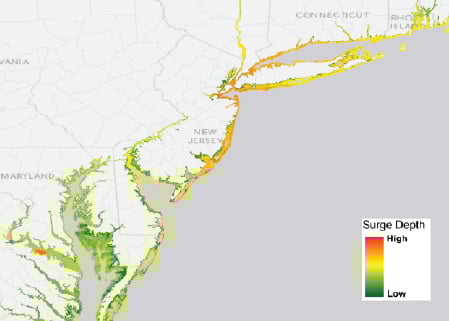
The storm's impacts were most evident in coastal areas of New Jersey and New York, the most populous and highly developed part of the country. Observations indicate that Sandy's wind field was broad but moderate, and that light to moderate wind damage was inflicted in other locations. However, storm surge impacts from Sandy were heightened due to the fact that the surge coincided with two tide cycles elevated by a full moon. A record storm tide of 11.28 feet was noted at the Battery in lower Manhattan. Flooding devastated coastal communities and brought significant portions of New York to a halt. (Read about AIR's survey of Sandy's damage in the AIR Currents article Insights into Damage and Vulnerability from AIR's Sandy Survey Teams.)
What to Take Away from 2012
The 2012 season reminds us once again that an abundance of named storms in the Atlantic basin does not necessarily translate to a high number of U.S. landfalling hurricanes. Since the current period of warm SSTs began in 1995, seven seasons have experienced above-average hurricane activity in the basin with zero or just one U.S. landfall. Only five of the last 16 seasons have seen more landfalling hurricanes than the long-term average of two. Overall, the 33 loss-causing U.S. hurricane landfalls since 1995 fit well with what one would expect looking at records since 1900. Of course, as Sandy demonstrated, a single storm can produce very large losses.
The count of damage-causing storms experienced since 1995 falls in line with the landfall frequency estimated in both the AIR standard and warm SST catalogs. Both catalogs are credible and continue to provide value as a means of supporting better-informed risk management decisions. Catastrophe models are the best tools to understand the risk from perils, such as hurricanes, where historical losses have been volatile and company claims data are often limited.
This past year demonstrated the uncertainty and year-to-year variability in hurricane activity and the importance of considering multiple long-term views of risk. In particular, Hurricane Sandy reminded us—not-so-gently—that storm surge can be more devastating than wind and that hurricane risk in the Northeast is significant and should be accounted for in any complete view of U.S. wind risk.
