


The 2011 Thai Floods: Changing the Perception of Risk in Thailand
Apr 19, 2012
Editor's Note: The 2011 Thailand flood was one of the most severe in modern history; not only did it devastate a major city, but its impact on manufacturing supply chains propagated around the world. In this article, Senior Principal Scientist Peter Sousounis explains what made the Thai floods so severe; the article goes on to highlight insurance implications for Thailand, and the industry as a whole.
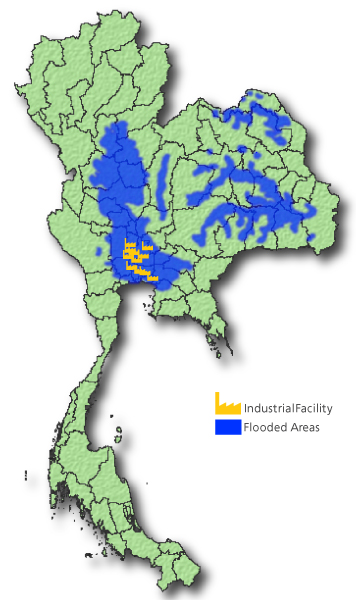
Since the beginning of time, rivers have been at the heart of commerce. In Thailand, business is concentrated around the Chao Phraya River, which runs through the country's central plains to the capital, Bangkok, before emptying into the sea. The river's basin is home to 40% of Thailand's citizens, employs 78% of its workforce, and generates 66% of its GDP1.
In late July of 2011—with the monsoon season well underway—the Chao Phraya began to overflow. Then Tropical Storm Nock-Ten made landfall in Northern Vietnam, and remnants of Nock-ten crossed westward to northern Thailand, delivering heavy precipitation that caused flash flooding. Fed by these flood waters, additional monsoon rains, and precipitation from four more tropical storms through September, the Chao Phraya River continued to swell. Bangkok—positioned 231 miles to the south, near the river's mouth—was in the direct path of the flow.
Although sand bags and other temporary embankment structures were put in place to protect the city, they proved insufficient. By October, parts of the normally bustling capital were inundated. Hardest hit was the manufacturing industry in Ayutthaya province, just north of Bangkok; seven major industrial estates there (containing more than 800 factories) experienced floodwaters as high as 10 feet, resulting in significant disruptions to manufacturing supply chains, which in turn caused direct and indirect business interruption losses, both regionally and globally.
Flooding continued in some areas of Thailand until mid-January 2012; sixty-five of Thailand's 77 provinces were declared flood disaster zones and 13.6 million people were impacted in total. Reports suggest that up to 3.3 million structures were affected nationwide, including at least 750,000 residential properties. According to the World Bank, the flood caused an estimated USD 45.7 billion in economic damage, making it the world's fourth costliest disaster in terms of economic losses.

By: Dr. Peter Sousounis
Edited by Meagan Phelan
The article: Overviews the massive floods that devastated Thailand, including Bangkok, in the latter half of 2011.
Highlights: Prior to this event, Thailand was not considered a peak risk area. While the final losses from the 2011 Thai floods are still being developed, the impact of this event will reverberate through the domestic insurance industry and the global reinsurance industry, which is now more closely attuned to exposures in unmodeled or poorly modeled regions.
The Makings of a Flood
Although flooding is an annual occurrence in Thailand and particularly common in the lower Chao Phraya River Basin, the torrent of water that impacted large parts of the country last year was exceptionally severe. Precipitation-induced flood typically results from the interplay of several factors. These include soil moisture conditions (or antecedent conditions), terrain characteristics (slope) and water and land management practices related to dams, reservoirs, and urbanization. The most essential, however, is precipitation; a flood can't happen without water.
Conditions setting the stage for last year's floods began taking shape in March, which saw unseasonably heavy precipitation. Antecedent soil moisture conditions, extending as far back as 2010, may also have played a role (beginning in August 2010, precipitation was 33% above average for north-central Thailand).
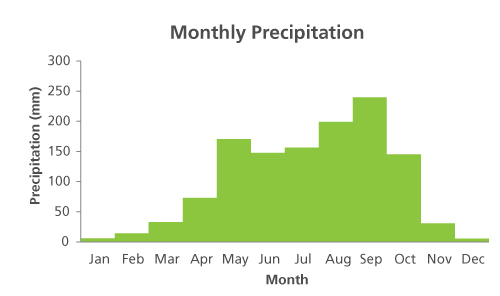
Then the monsoons arrived, adding water to rivers and soil that could not accommodate more. Like much of tropical Asia, Thailand receives the bulk of its precipitation (more than 90%) during the monsoon season, which extends from May through October (Figure 1). As the core of the monsoon swings northward across Thailand in May and then southward across the country in October, both of these months are marked by spikes in precipitation levels.
The monsoon is not the same from year to year; climate factors determine its onset, strength, and position. The El Niño/La Niña-Southern Oscillation (ENSO)—one of the best known climate signals in the tropical Pacific—plays a significant role. During the cold phase of the signal (La Niña), which persisted through much of 2011, an atmospheric phenomenon called the Walker Circulation shifts farther west, aided in part by the stronger than normal northeasterly trade winds. As a result, monsoonal rains over Thailand are enhanced. (Moreover, the strong trade winds typically constrain tropical cyclones along a more westward track—into Vietnam and Cambodia, from which they can impact Thailand.) La Niña conditions are also associated with a favorable Madden Jullian Oscillation (MJO)—identified on satellite imagery as enhanced regions of convection, or cloudiness—which can further enhance precipitation.
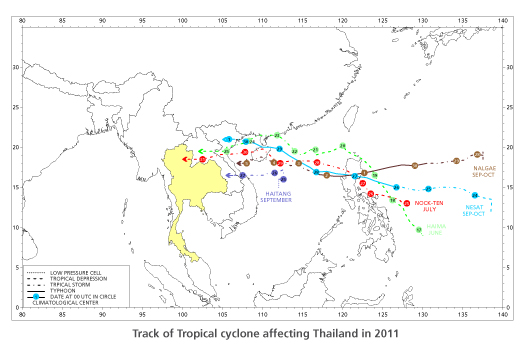
While the monsoon is the main contributor of precipitation in Thailand, other weather systems can enhance rainfall during monsoon months. Tropical cyclones, for example, can generate copious amounts of precipitation long after strong winds have diminished. Though Thailand is rarely impacted by typhoon winds, the remnants of storms crossing Vietnam, Cambodia and Laos from the east generate heavy precipitation in Thailand on a near-annual basis. In 2011, the remnants of five typhoons—Haima in June, Nock-Ten in July, Haitang in September, and finally Nesat and Nalgae in late September and early October—generated copious amounts of rainfall (Figure 3 shows the tracks of these storms). The high level of typhoon activity was consistent with strengthening La Niña conditions.
Notably, just as Haitang, Nesat, and Nalgae (all September storms) were poised to do their damage last year, La Niña conditions strengthened once again, and the MJO became favorable for deep convection. As a result, September precipitation for the north-central region of Thailand was 40% above normal. Indeed September was the seventh straight month with above-normal rainfall levels.
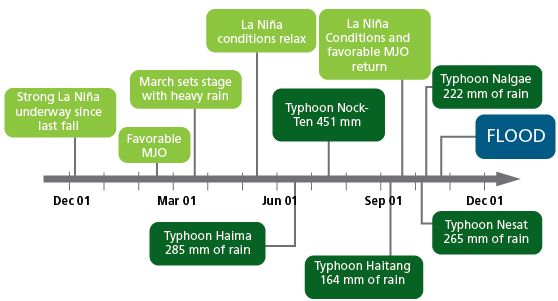
Figure 3 shows a timeline of ENSO, MJO, typhoon activity, and precipitation for 2011. Even before the monsoon season began, Thailand's rivers, tributaries, and soil were already saturated.
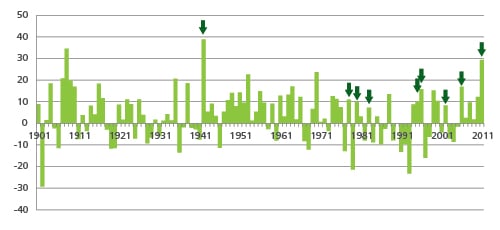
The shear number of factors at play make predicting the likelihood of flooding in Thailand—or elsewhere—challenging. Figure 4 shows the historical record of annual precipitation for the north-central Thai region. The nine years in which significant floods occurred—1942, 1978, 1980, 1983, 1995, 1996, 2002, 2006, and 2011—did exhibit above normal precipitation. But, importantly, not all years in the historical record with heavy precipitation experienced severe floods, and not all years in which floods have occurred have been characterized by heavy precipitation, highlighting the difficulty of developing a simple rainfall-flood relationship.
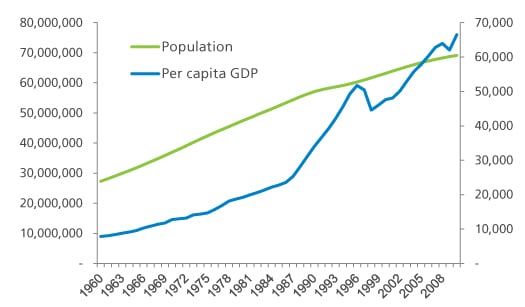
Flooding is a regular occurrence in Thailand, and as the population and number of exposed properties continue to grow (Figure 5), losses from this peril will continue to rise. Thus, the region stands to benefit from engaging in active research leveraging cutting-edge scientific information and tools, like those developed at AIR to study and model flood risk.
Supply Chain Disruption
One of the key lessons from last year's floods is the fragility of global supply chains to natural disasters. Thailand is the world's second largest manufacturer of hard disk drives and a major Asian manufacturing hub for foreign car companies. When the floods struck in October, hundreds of factories shut down.
Indeed, the ramifications of the floods were both broad and deep. After the Tohoku earthquake in Japan in March 2011, for example, many of Japan's industrial facilities transferred production to Thailand. When production in Thailand was suspended, Japan's domestic insurance market was faced with absorbing additional unforeseen expenses.
By mid-November, some of the companies that had partially resumed production included Nissan Motor Company, Toyota Motor Company, and Mazda Motor Corporation, but more than half of the manufacturing facilities near Bangkok remain closed. The secondary impact of the Thai floods—supply chain interruption that resulted from halted production at these facilities—resulted in a wave of business interruption claims around the globe.
Insured Loss Estimates Still Developing, Economic Recovery Continues
In 2011, natural catastrophes including the Thailand floods and the earthquake and tsunami in Japan contributed to the second highest2 annual insured catastrophe losses ever recorded: USD 116 billion.
Estimates of insured loss from the Thai floods are still being developed; due to the general shortage of data on exposures in Thailand and the duration and severity of the floods, it will take the insurance industry substantial time to determine their true impact. Greatly exacerbating matters is the complexity associated with direct and indirect business interruption claims.
Over the past few months, insurers have been sending loss adjustment teams into industrial parks and other flood-affected locations to evaluate the extent of damage, often revising loss estimates upwards after these visits. Since December of 2011, the estimates have doubled, from USD 8-11 billion at the end of last year to USD 15-20 billion now, with a large majority of these coming from commercial business interruption to manufacturing facilities. (Residential insured losses, by contrast, are expected to be minimal since only 1% of properties are covered for flood damage.) Ultimately, the loss estimates could rise higher still, highlighting the need for global (re)insurers to improve their understanding of the possible scale and nature of losses that can occur in as yet unmodeled or poorly modeled parts of Asia.
Meanwhile, six months after the floods struck, which caused Thailand's GDP to shrink by more than ten percent in the last quarter of 2011, signs of recovery are slowly emerging. In February, Thai exports rose for the first time since October. Thailand's Monetary Policy Committee (MPC) expects industrial production to return to normal by 2012's third quarter.
A Changed Perception of Risk
Before last year's floods, the insurance industry did not view the Thai non-life insurance market as catastrophe-prone. Perhaps not surprisingly then, the total premiums paid by Thai policyholders in the previous year were two to four times less than the estimated flood losses. (By comparison, the premiums produced in Japan were more than three times the insured losses that resulted from the Tohoku earthquake.)3
The higher-than-expected losses associated with the Thai floods changed the perception of risk in Thailand. The event is also bringing about changes to the local insurance industry in the form of higher flood insurance premiums. Premiums are also higher for significant industrial risks.
Because there is a shortage of reinsurance capacity in Thailand, about 90 to 95% of the related losses were ceded to international reinsurers. The Japanese (re)insurance industry—which provided cover for many Thai industrial parks—was especially hard hit, suffering significantly higher net losses from the Thai floods than it had from the Tohoku earthquake.
The Thai floods and other 2011 Asia-Pacific loss events have sounded an alarm to the reinsurance industry; as it expands business to emerging markets, a more comprehensive understanding of the specific risks (i.e., risks from secondary agents, like business interruption) will be critical.
Conclusion
To ensure that future floods are not so devastating, the Thai government is spending on the order of USD 8 billion over the course of the next five years to develop flood mitigation infrastructure. To provide adequate (re)insurance capacity for future catastrophe events, the government has ordered the creation of the National Catastrophe Insurance Fund, which will offer coverage for damages caused by earthquake and windstorms, as well as floods.
Thailand is not unique in its flood risk; flood risk hot spots exist elsewhere in Asia. In 2007, a report issued by the Organisation for Economic Development and Co-operation (OECD)4 ranked Bangkok seventh and tenth, respectively, in terms of populations and assets exposed to flooding. Outside Bangkok, the report's rankings were dominated by cities in China and India. In these countries, as in Thailand, the heightened flood risk is due in part to rapid urbanization and population growth, which must be accounted for in city planning. Metropolitan areas in China and India are also home to industrial facilities, many of which are nodes in supply chains that stretch globally; the economic impact of business interruption from flooding like that seen in Thailand could be equally devastating.
Instead of relying on extrapolations of recent catastrophe experience, flood-prone countries need to employ scientifically-based modeling approaches, like those developed by AIR, to more comprehensively understand (and prepare for) future flood risk.
1 Source: AXCO, 2012. "Insurance Market Report," Thailand: Non-Life (P&C), AXCO Insurance Information Services, London, UK.
2 This year was second only to 2005, when Hurricane Katrina devastated New Orleans. Source: Swiss Re.
3 Standard & Poor's (S&P) Ratings Services report, "Thai Floods Dampen Asian Insurers' Earnings And Capitalization." Published Feb 29, 2012.
4 The report was part of a 2007 Organisation for Economic Development and Co-operation (OECD) project on Cities and Climate Change.
