


Ten Years after the Elbe Floods: Putting Lessons Learned Toward the Development of a Detailed Flood Model
Aug 23, 2012
Editor's Note: The Elbe floods affected large areas of eastern Germany, Austria, and western Czech Republic. In the aftermath, AIR responded to the industry's call for more detailed approaches to assessing loss potential. In this article, Tobias Klier, Andreas Reiche, Yörn Tatge, and Meagan Phelan highlight several features of the AIR Inland Flood Model for Germany that address issues raised by the Elbe floods.
Ten years ago this month, flooding along the Elbe River—which flows from the mountains of the Czech Republic, through Germany, and on to the North Sea—resulted in one of the mostly costly natural flood disasters on record. Having been fed by relentless summer rains (over 200 millimeters of precipitation fell in some parts of Germany), water levels on the Elbe had reached those of a 150- to 200-year return period event.
The worst flooding started in a tributary of the Elbe, Germany's Mulde River, where water levels rose 65 centimeters above the previous record set in 1845. Farther south, in Dresden, the Elbe River swelled from its typical summer level of two meters to nearly nine and a half meters—the highest ever recorded.
As water continued to accumulate, the Elbe River overflowed—in some cases, bursting levees. The result was ruinous damage in many cities and towns, including Dresden, Wittenberg, Dessau, and Magdeburg. The 2002 flooding had a particularly damaging effect on businesses; more than 12,000 were affected in Germany alone, causing business interruption losses in excess of EUR 750 million. Just five years prior, the Oder River floods—comparable from a meteorological standpoint—had also wreaked havoc in Germany. But because that event impacted mostly rural locations, losses were much lower. In all, the Elbe floods resulted in insured losses of EUR 3.1 billion—four times the cost of the Oder floods.
Perhaps the greatest lesson learned following the Elbe floods was that, until this point, flood loss potential in Europe had been vastly underestimated. Indeed, after the Oder flood in 1997, the 2002 floods were the second flood event in central Europe in half a decade with an estimated return period exceeding 100 years. Governments throughout the region acknowledged the need to be better prepared, including through insurance solutions—and through the use of models to better assess the risk.
But modeling the flood peril is extremely challenging and requires a sophisticated blend of meteorology, hydrology and hydraulics, the exact location of exposures, and digital terrain models for reliable computation of surface shape and water flow. In 2002, no models existed that could accurately estimate the extent of losses Europe might experience. Meanwhile, the losses from flooding—the continent's second costliest atmospheric peril—continued to increase.
In this setting, AIR began work on what would become the industry's most comprehensive flood model for countries in Europe. The rest of the article discusses some of the challenges of modeling flood in Europe and AIR's approach for addressing those challenges.

By: Tobias Klier, Andreas Reiche, Yörn Tatge, and Meagan Phelan, CCM
Capturing Off-Floodplain Losses
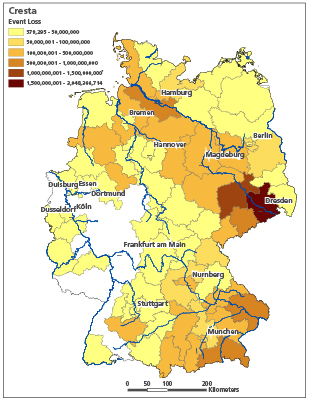
Although flooding is most often associated with floodplains—the flat areas adjacent to rivers—losses during the Elbe event had a significant off-floodplain component. In a simulation run by AIR using the AIR Inland Flood Model for Germany, modeled losses to all properties in CRESTA zones affected by the Elbe floods were evenly split between on- and off-floodplain (Figure 2).
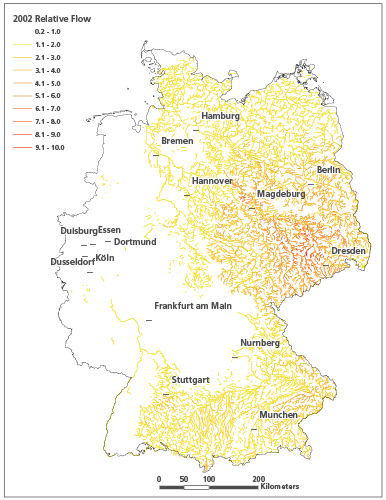
In the AIR model, off-floodplain flooding is captured using the specifics of more than 35,000 small catchments in Germany, as well as the relative elevation, relative runoff, and population density at the off-floodplain location.
Location is Everything
Flood risk assessment is very sensitive to location; just a few tens of meters shift in the location of an exposure towards or away from the flood extent can determine whether damage is incurred. Consequently, entering accurate location data into a flood model is critical to reliable results.
Single-Risk Location
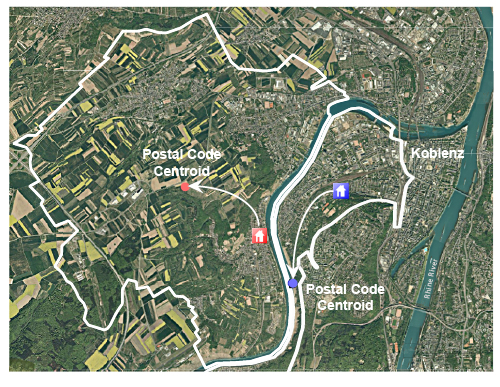
The importance of accurate geocoding is illustrated in Figure 3. Shown are two risks at their correct street-level addresses in two different postal codes. If exposure data is aggregated to postal code centroid, the risk on the left (designated by the red house) would shift away from the river and losses would be underestimated. By contrast, the risk on the right (designated by the blue house) would be shifted too close to the river and loss would be overestimated.
To quantitatively assess the impact of the geocoding resolution on losses, AIR ran an analysis in CLASIC/2™ for several CRESTA zones affected by the Elbe floods, comparing results from using exposure aggregated to postal code centroid with results using street address level. AIR ran the analysis using AIR's industry exposure database for Germany. Results are shown in Table 1.
| CRESTA Zone | ||||
|---|---|---|---|---|
| Exposure Resolution | 01 | 06 | 21 | 39 |
| Latitude/Longitude | 2,573 | 212 | 552 | 202 |
| Postcode | 2,848 | 187 | 295 | 322 |
| Difference | 10% | -13% | - 87% | 37% |
While the deviations for some CRESTA zones in this analysis were rather minor (±10%), there were notable deviations for zones 21 and 39, which saw losses decrease by 87% and increase by 37%, respectively. Note that running an analysis with aggregated exposure may lead to either over- or underestimation of the actual loss. For the most accurate flood loss estimates possible, AIR recommends using data geocoded at the street address level.
To implement street address level geocoding, CLASIC/2 users can license Trillium Software® Global Locator. High-resolution geocodes from Trillium are stored in AIR's CLASIC/2 database. Clients can also use other third-party geocoding solutions to geocode street level address data and import it into CLASIC/2.
Large Industrial Facilities
For some risks—in particular, high-value industrial facilities—even address level geocoding may not be sufficient. Typically, at such locations, multiple buildings and other structures are present and they can be spread over a large area. To accurately estimate losses to such facilities, the total replacement value must be accurately distributed over the area, which could exceed several square kilometers. Because standard model settings associate a risk's replacement value with a single geocode, a more advanced approach is needed for industrial facilities. AIR created a unique solution that complements its CLASIC/2 software. This approach, which is detailed in the example here, uses a grid to distribute replacement values over large areas.
The largest single flood claim ever recorded in German insurance history was that to a manufacturing company; by the end of 2010, its insurance claims arising from a single plant in eastern Germany had totaled more than EUR 100 million. The facility—located along the Spree River (a tributary to the Oder)—extended nearly one km from north to south, and half a km from east to west. Following dike failures along the Oder River, it suffered extensive damage; in some parts of the facility, especially those in the western part of the site nearest the Spree, flood waters exceeded a meter.
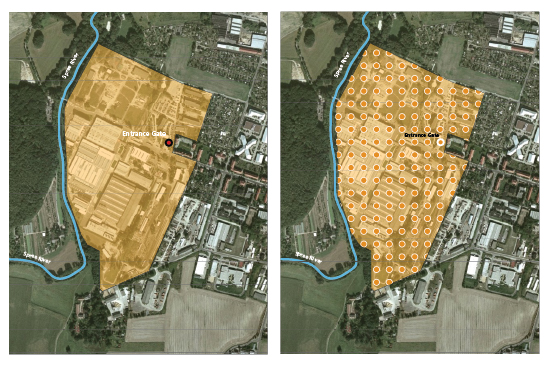
The address level geocode for this site is at its entrance gate, half a kilometer from the river and three to four meters in elevation above the western part of the facility; in other words, if the address-level location were used, the facility's total insured value would be geocoded to a point relatively far from and elevated above the flood threat, while in reality many parts of the facility were much more vulnerable (Figure 4).

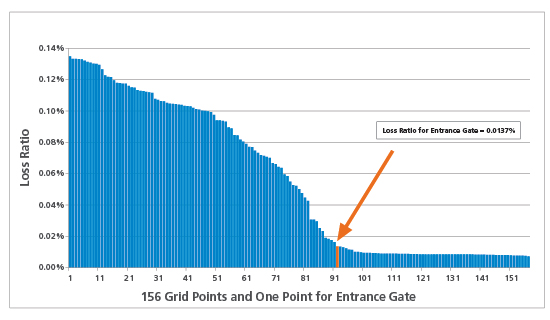
To show the impact on modeled average annual loss (AAL) of distributing the facility's replacement value over the entire area—rather than associating the total insured value with a single geocode far from the river—AIR used GIS and satellite data to uniformly distribute the replacement value to 156 points (Figure 5). (In this example, the replacement values used were EUR 5 billion for buildings, EUR 2.5 billion for contents, and EUR 2 billion for business interruption.)
AIR then ran 10,000 years of simulated flood activity against the exposure, twice. For the first run, the replacement value of the site was concentrated at the entrance gate; losses generated only accounted for flood risk to this particular location. For the second run, replacement values were evenly distributed across 156 grid cells at a roughly 50-meter resolution. The outcome is shown in Table 2. The overall loss ratio for the gridded approach is three times as high as the loss ratio obtained using a single geocode.
| Entrance Gate | Gridded Exposure | |
|---|---|---|
| AAL (in EUR millions) | 1.3 | 5.4 |
| Loss Ratio | 0.0137% | 0.0563% |
Figure 6 shows the loss ratio for each of the 156 grid points (and for the entrance gate), illustrating the contribution to the AAL from each of the points and providing further confirmation of how much flood risk at this facility was under-estimated by aggregating exposure to a single point.
In light of these results, AIR recommends that companies with portfolios of high-value industrial facilities investigate their key loss-driving risks. AIR can work with clients to perform exercises similar to the one described above.
Using Secondary Modifiers for Greater Accuracy
The more information a company has about their exposure, the more reliable will be the model results. To that end, the AIR Inland Flood Model for Germany offers support for several "secondary modifiers"—individual risk characteristics that can have a major impact on loss potential. A few are described below.
Custom Flood Protection
Another important consideration in the modeling of industrial facilities is the presence of custom flood defenses. Large industrial sites are often located close to navigable rivers and thus more exposed to flooding. For this very reason, management may install custom flood defenses to protect them. The AIR model offers a secondary modifier ("custom flood protection"), whereby users can add details about these structures and appropriately capture their loss mitigating effects.
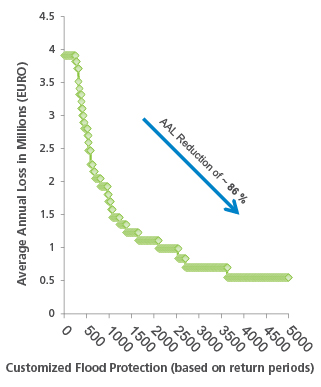
Secondary modifiers like custom flood protection can be used to conduct critical sensitivity tests. Figure 7 considers the effect of custom flood protection on losses at the same industrial facility presented in the previous example. Note that by varying the facility's custom flood protection, losses can be decreased by 86%.
Floor of Interest
Residential risks are sensitive to the depth of floodwater, and cellars are particularly susceptible. In CLASIC/2, companies can analyze the risk to a specific floor or floors of interest. For example, they can analyze the contribution to their overall losses from all cellars they underwrite, basing underwriting guidelines on this information.
Flood Zone
The German Insurance Association has developed a flood hazard zonation system called "ZÜRS," which serves as the benchmark for flood underwriting. If it is known in which flood zone the risk being underwritten is located, the model user can import that detail into CLASIC/2 using the secondary modifier field "flood zone."
Users can filter their runs by flood zone risk class. For example, a user could conduct an analysis in which all risks in ZÜRS zone 4—the riskiest in Germany—are excluded.
Redefining Loss Occurrence with the Hours Clause
The impact of a flood on the insurance industry is complicated by the fact that there is no unambiguous correlation between specific meteorological events and flood extent. The video below shows how flood waves from two rain storms in Germany accumulate in the country's rivers, leading to flooding. The first rainstorm delivers precipitation to one location, increasing the amount of water (as symbolized by the red circles) in the country's river systems. A subsequent system farther south adds to this amount. As the time stamp of the video shows, it can take weeks for the water to propagate down river to the ocean. In the case of Elbe floods, it took about 12 days (288 hours) for water to go from the Czech border to the North Sea.
To account for the fact that there is no direct relation between an actual meteorological event delivering precipitation and the extent of the flooding that results, the hours clause was introduced. This clause helps to define events in cases of complex meteorological circumstances.
In the last decade, large loss catastrophes including the Elbe floods have prompted the industry to rethink traditional excess of loss reinsurance contracts that rely on an hours clause to define what constitutes a flood event. Before the Elbe floods, the predominant hours clause for flood was 168 hours. After the devastating floods of 2002, however, and because of its length, the standard flood hours clause in Germany and other European countries changed from 168 to 504 hours.
To accommodate widely used methods of event identification for insurance purposes, the AIR model identifies flood events within the context of the 504-hours clause.
Closing Thoughts
Flooding remains a regular occurrence in Germany—one not limited to the coast or low-lying river valleys, but nearly ubiquitous due to off-floodplain flash flooding. AIR's high-resolution Inland Flood Model for Germany provides a fully probabilistic approach for determining the likelihood of losses from all manifestations of floods, including the most extreme events that exceed the scope of historical experience.
As discussed in this article, the AIR model accounts for both on- and off-floodplain losses, supports street address level geocoding, includes several critical secondary modifiers with which users can evaluate loss sensitivity, and it supports the predominant hours clause in the industry today.
