


Modeling Bushfires Down Under
Apr 19, 2012
Editor's Note: AIR has developed a bushfire model for Australia that will be available this summer. Dr. Tomas Girnius describes Australia's long and costly experience with bushfires and explains how AIR's approach to modeling an entire continent—an area 18 times that of wildfire-prone California—overcomes the inherent challenges a country so large and diverse presents to modeling.
Bushfires occur throughout the Australian continent. Called "wildfires" in the United States (a usage becoming increasingly common in Australia as well), bushfires are uncontrolled fires that start through a wide variety of means—lightning strikes, downed power lines, ruptured gas mains, casually tossed cigarettes, arson—and threaten extensive damage and harm when they reach a large size and high intensity. The losses from Australian bushfires can be substantial—and they will continue to increase as long as properties continue to be built in areas of high hazard. This article explores the history of bushfires and describes a new tool for managing the risk.
A Long History of Bushfires
In early February of 2009, the region north of Melbourne, the capital of Victoria, was suffering from a decade-long drought. On February 7th, a Saturday, temperatures rose to 46° centigrade (115° Fahrenheit), the highest temperature recorded in the city since official record-keeping began 150 years earlier. Trees, bushes, and underbrush were paper dry.
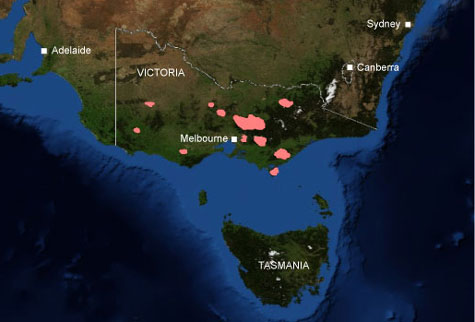
Fires broke out in multiple places and raced across the region, propelled by winds gusting to more than 95 kilometers an hour (60 miles per hour). At one point, as many as 400 individual fires were reported, although only about a dozen ultimately caused property damage. By the time they were contained, the "Black Saturday" fires had become the deadliest natural disaster to strike Australia in over a century. Figure 1 below shows the locations of the major Black Saturday fires, with their concentration north and east of Melbourne.

By: Dr. Tomas Girnius
Edited by Robert Zalisk
The article: Describes Australia's long history with bushfires, identifies and explains the factors that contribute to producing bushfires in the Australian environment, and gives some examples of how the forthcoming AIR Bushfire Model for Australia can be used to manage bushfire risk
Highlights: The 2009 Black Saturday bushfires caused insured losses of more than AUD1.3 billion. A scenario very much the same is found in the AIR Bushfire Model's 10,000-year stochastic catalog—and closely fits a stress test required by the Bermuda Monetary Authority. But exploring "what if" scenarios is just one of many uses of this new tool to manage bushfire risk Down Under.
Black Saturday burned through 4,400 square kilometers (1,700 square miles) of countryside. About 3,500 structures of all types were destroyed—more than 2,000 of them homes—and many more were damaged, leaving nearly 8,000 people homeless. More than 170 people were killed, and more than 400 were injured.
Before the Black Saturday fires there had been the Black Friday fires … and the Red Tuesday, Ash Wednesday, and Black Sunday fires. Bushfires are not only common in Australia, they are an integral part of the ecology that characterizes the country. The continent's northern boundary lies only 12 degrees (roughly 850 miles) south of the equator. Except for Antarctica, it is the driest continent. It is also relatively flat. Less than one percent of the entire continent rises above 1,000 meters (3,281 feet).
Once Australia arrived at its present distance from the equator, its earlier ecosystem, which had been dominated by lakes, wetlands, rivers, and rainforests, gave way to dry grasslands and a more arid desert-like landscape, especially in the interior. Fires became a common occurrence in this environment. And with no great mountain chains or rivers breaking up the continent, there were no geographic barriers to check the fires' expansive spread.
Many plants evolved strategies that allowed them to survive—and even to thrive with—these often-recurring bushfires. Eucalypts, which make up roughly 70% of the Australian forest today and include the familiar eucalyptus tree, are an example. Rich in highly flammable resins, and having branches and bark that readily shed and quickly accumulate, eucalypts are fuel waiting for a spark. But having also evolved fire-resistant fruits and the ability to sprout new shoots from buds buried deep within the tree, their very flammability gives them a competitive advantage over other species.
Every year, on the order of 10,000 bushfires break out in Australia. Most of these fires, however, are small, quickly burn out or are put out, or take place in the arid but sparsely populated outback. Of all these many fires, no more than a dozen or so cause property damage in any year, on average.
But when bushfires do spread into populated areas, they can be deadly and very costly. According to a 2001 Australian Government report, major bushfires in the 30-plus years between 1967 and 1999 cost the country about AUD 2.5 billion at the time (close to AUD 4 billion in today's currency). Additionally, bushfires alone accounted for 39% of the deaths and 57% of the injuries caused by all major natural disasters that befell Australia over the same period of time.
In the decade since then, as population has increased and more and more people have come to build and live where bushfires are likely to burn, more major fires have occurred—in Victoria, in the Canberra Capital Territory, in New South Wales, in Western Australia—and losses have increased. The 2009 Black Saturday fires, for example, caused insured losses of more than AUD1.3 billion.
Modeling Bushfires
The conditions that came together on Black Saturday—prolonged drought, an abundance of volatile fuels (dry vegetation), high temperatures, and high winds—basically define the "perfect" circumstances that allow a bushfire to run quickly out of control and cause havoc. (These same factors also provided, for example, the setting for the Oakland Hills fire of 1991 in Oakland, California, the costliest wildfire in the history of the United States.) All that's additionally needed is a spark.
These conditions can be modeled, allowing for a large number and variety of simulations for use in managing bushfire risk. The AIR Bushfire Model for Australia, scheduled for release this summer, employs several parameters that drive the generation of the model's large and robust catalog: ignition frequency, fire locations, available fuel, weather (seasonal conditions and wind characteristics), and topography (the ground surface features that can affect winds and modulate the volatility of the area's vegetation, thus influencing the speed and direction with which a fire will spread).
Initial Conditions: Frequency and Location
Since so many thousands of fires ignite in Australia every year, it is of central importance for a model to be able to identify and realistically generate the relatively few ignitions that have the potential to develop into full-blown bushfires that cause property loss. The number of simulated events modeled in any given year is derived from a probability distribution based on historical data; on average, the model generates about 12 loss-causing bushfires in a simulated year—in line with the historical average.
The seasonality of bushfires is another important model parameter, and it varies by region. Australia is so large that there are local climates. While bushfires in the southern states tend to peak in March through May, in Queensland and the Northern Territory, activity shifts to later in the year.
Modeled ignition locations, too, are based on historical data obtained from high-resolution satellite imagery. When that data is cleaned of corrupt records and spurious "hot spots" (such as those generated by industrial sites, mines, rocks heated by the sun, etc.), the remaining records can be analyzed to obtain an accurate record of historical bushfire locations. Those locations are mathematically smoothed to obtain a spatial probability density function with a resolution of about ten kilometers.
Fire Spread
By stochastically determining the specific location point for bushfire ignition, the model also determines the fuels and ground and weather conditions. To generate the extent and shape of a potential fire's ultimate perimeter, the model uses a fire propagation algorithm developed at AIR. The algorithm begins the simulation at the ignition point; the fire then spreads radially depending on the kinds of fuels in the vicinity, on local topography, and on whether barriers to the spread are encountered, such as roads, rivers or deserts (where there are no fuels to propagate the fire). The model adjusts the rate and direction of the spread according to a simulated wind profile, and the spread is terminated when either a target fire size is attained (drawn from a probability distribution based on historical data) or the available fuels are exhausted.
This component of the model incorporates a variety of large datasets obtained from local sources: fuels data, for example, comes from Australia's Department of Environment and Water Resources and the Department of Agriculture, Fisheries and Forestry; topographic data comes from Geoscience Australia; and data on wind speed and direction is from the Bureau of Meteorology.
Multi-Fire Clusters
One of the distinctive characteristics of Australian bushfires, and one that can significantly exacerbate losses, is that they tend to occur in clusters. The individual fires that make up a cluster can still be large and intense—as certainly was the case with many of the Black Saturday fires—but an actual bushfire event does not necessarily fit the notion of one fire starting at a single ignition point and spreading across large distances (although that conception does slightly better fit the wildfire experience in California).
In the AIR model, a bushfire cluster is defined as "fires that ignite within 168 hours (one week) of one another and are separated by a distance of no greater than 200 kilometers (125 miles)." The AIR bushfire model explicitly models cluster events. Indeed, the model's 10,000-year catalog includes 6,933 multi-fire events, each of which is an event as defined above that consists of between two and 112 individual fires.
Putting the Model to Use
Although the AIR Bushfire Model for Australia is due for general release this summer, a pre-release version has already been put to good use. The Bermuda Monetary Authority (BMA) recently required insurers under its regulatory regimen to conduct certain financial stress tests in order, as the BMA said (in its "2011 Capital and Solvency Return" document), "to assess the capital adequacy of the insurers and groups under adverse economic and underwriting conditions." More specifically, the BMA wanted an assessment of the impact that a variety of non-peak peril scenarios—including Australia bushfire—could have on an insurer's statutory balance sheet "as determined by the insurers'/groups' internal model and/or vendor model(s)." Using the AIR Bushfire Model for Australia, AIR was able to assist in carrying out the task.
The kind of catastrophic bushfire event the BMA described matched in many ways the February 2009 Black Saturday disaster:
The insurer/group is to assume a series of bushfires during extreme bushfire-weather conditions across Australian states affecting populated areas. Assume: 1) 180 fatalities; 2) 500 people with mild-to-serious injuries; 3) displacement of 7,600 people; and, 4) destruction of over 5,000 buildings (commercial, residential, and other outbuildings included.) Assume an estimated insured industry loss of US$1.3 billion.
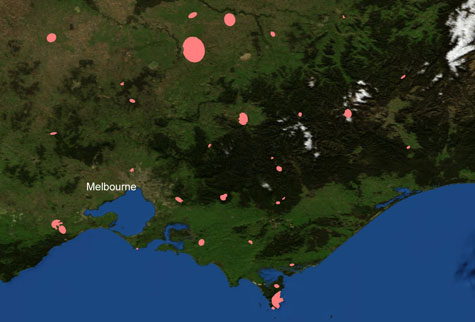
Drawing from the Australia bushfire model's 10,000-year catalog, AIR identified an event that met the requirements of the BMA. The simulated cluster occurs in the same general area as Black Saturday (Victoria) and produces similar property losses—approximately AUD 1.25 billion, which in the AIR model corresponds to a roughly 2% exceedance probability. (The AIR model does not directly account for the human toll, although it is plausible that a probabilistic simulation whose property losses resemble those of an historical event will have similar human costs as well.)
Exploring Larger Loss Scenarios
It is important to point out that any number of scenarios could produce levels of loss similar to—and larger than—the losses assumed by the BMA for its stress test. Figure 4 shows another simulated event from the AIR model, this one located on the island state of Tasmania. One of Australia's most damaging bushfires, the "Black Tuesday" fires, took place here in 1967, killing 62 people and destroying or damaging 1,300 homes.
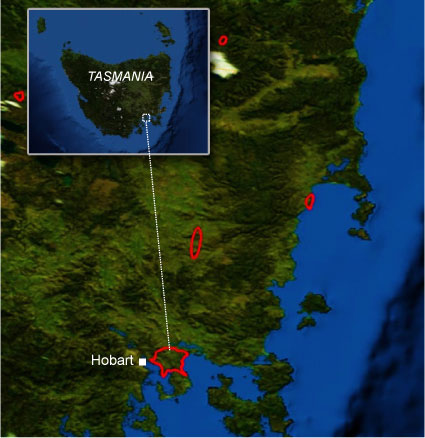
The red outlines in Figure 4 trace the simulated fire perimeters of this cluster event which produces insured losses of more than AUD 3 billion, largely because of the proximity of the largest footprint to the state capital, Hobart. Such a loss corresponds to a 1% exceedance probability in the AIR model.
Closing Thoughts
Bushfires in Australia are the natural product of the continent-wide aridity, frequent periods of drought, high temperatures, parched vegetation, and the recurrent strong, steady winds that are characteristic of the country. Fires that once ranged across hundreds of miles of unbroken grassland and accommodating forests, today will burn through people's homes and towns, causing significant damage, large losses, and substantial grief.
This risk can be managed, although Australia's very size—nearly 20 times the area of California—makes the task daunting. The AIR Bushfire Model for Australia generates demonstrably realistic scenarios of loss. It filters the roughly 10,000 continent-wide ignitions that occur in Australia every year down to the dozen or so that are likely to cause significant losses. It includes a large and robust event set of simulated fires in the locations where they are most likely to occur, and explicitly models the tendency of fires to occur in clusters.
While this article has focused on the bushfire hazard, it should be noted that the AIR model also incorporates a detailed country-wide industry exposure database, and its damage functions account for a comprehensive set of construction and occupancy classes while also being able to accommodate a variety of individual risk characteristics. Perhaps most importantly, the model has been extensively peer-reviewed and validated against actual loss experience data and post-disaster survey findings.
Bushfires in Australia will continue to present serious dangers to people and property, but a tool is available now that can help companies manage that risk.
