


Managing Tropical Cyclone Risk Down Under
Oct 24, 2012
Editor's Note: Thousands of kilometers of Australian coastline are susceptible to tropical cyclones. Using three historical events as examples—Tracy, Wanda, and Vance—Senior Principal Scientist Dr. Peter Sousounis and Senior Writer Robert Zalisk outline the country's costly experience with tropical cyclones and show how the AIR Tropical Cyclone Model for Australia can help manage the risk.
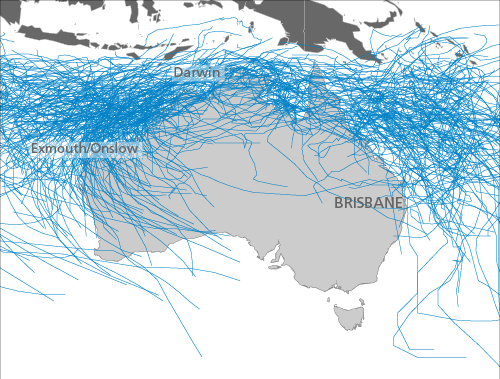
Australia's unique geography makes it a magnet for tropical cyclones. A quick glance at a map (see Figure 1) shows the narrow east-west corridor between Indonesia and Papua New Guinea to the north and Australia to the south into which pass storms from both the east and the west. In just the last five decades, more than 500 tropical cyclones have formed in and passed through this region.
Losses in Australia from tropical cyclones can be substantial and result from a combination of three storm-related hazards: wind, storm surge, and precipitation-induced flooding. Severe Tropical Cyclone Tracy1 in 1974, for example, caused nearly AUD 5 billion in insured losses (in 2012 dollars), most of it from wind, while last year's Yasi caused more than AUD 1 billion of insured losses, but from wind, flood, and storm surge damage combined. This article outlines the general characteristics of tropical cyclones in Australia and the hazards they generate—and describes an updated AIR tool for managing the risk they present.
Australian Tropical Cyclones
The Australian tropical cyclone season lasts from November through April. Every year about a dozen named storms, on average, form in the waters around Australia—from the Indian Ocean to the Coral Sea—and, similarly, about five storms make landfall or pass close enough to land to cause damage. Figure 1 shows Australian tropical cyclone tracks since 1961 as recorded by the Australian Bureau of Meteorology (BOM).
The continental extent and diverse impacts of Australia's tropical cyclones can be illustrated by a brief look at three historical cyclones: Tracy, Wanda, and Vance.

By: Dr. Peter Sousounis and Robert Zalisk
The article: Uses three historical tropical cyclones to illustrate the wind, flood, and storm surge damage Australia suffers every year from tropical storms, identifies some specifically Australian conditions and circumstances captured by the AIR Tropical Cyclone Model for Australia, and demonstrates the value of using model simulations to stress test portfolios.
Highlights: AIR estimates that the occurrence of a storm similar to 2011's Cyclone Yasi farther south, near Brisbane, would cost the insurance industry nearly AUD 4.3 billion.
Tropical Cyclone Tracy's Winds Devastate Darwin
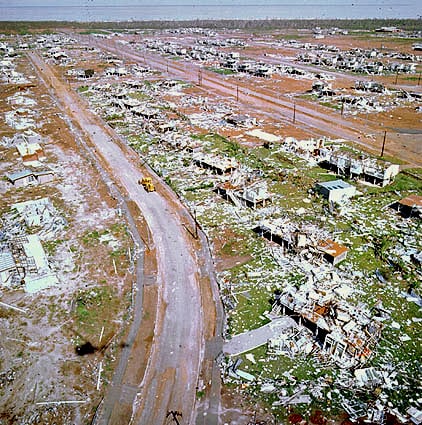
Severe Tropical Cyclone Tracy made landfall in the northern city of Darwin on Christmas Day, 1974. Tracy was small and short-lived, but intense, with sustained winds of more than 160 km/h (100 mph). A gust of 217 km/h (135 mph) was recorded at Darwin's airport before the storm shattered the anemometer. The storm's gale-force winds (64 km/h [40 mph]) reached across a 100 kilometer-wide area.
Tracy effectively destroyed the city. The light of Christmas morning revealed 70 % of all homes destroyed or severely damaged and, in many places, total devastation. All public services—communications, power, water, sewage treatment—were cut. Tracy remains the most damaging tropical cyclone to have struck Australia in at least the last 100 years. If the same storm were to happen today, AIR estimates that insured losses would be about AUD 4.8 billion.
Darwin's experience, however, initiated a reevaluation and substantial strengthening of Australian building codes and construction practices.
Tropical Cyclone Wanda's Heavy Rains Flood Brisbane
The devastation in Darwin was caused by Tropical Cyclone Tracy's winds. In contrast, Tropical Cyclone Wanda had weak winds but brought severe and extensive flooding—which put parts of Brisbane, the capital of the eastern state of Queensland, under several feet of water and inundated the surrounding countryside. More than 300 mm of rain (nearly one foot) fell on Brisbane in one 24-hour period.
Most of Queensland's rivers were at or near flood stage from earlier unusually heavy rainfall when Wanda made landfall north of Brisbane, in January of 1974. Wanda's torrential rains caused numerous rivers, including the Brisbane River, to overrun their banks. More than 50 homes were destroyed outright, some 1,600 were submerged, thousands of people were evacuated, 8,000 were left homeless, and 16 people were killed.
Wanda caused the worst tropical cyclone-induced flooding in Australia in the 20th century. If Wanda were to occur today, insured losses would be about AUD 2.4 billion.
Tropical Cyclone Vance's Storm Surge Undermines Western Australia Coastline
Severe Tropical Cyclone Vance made landfall on March 22nd, 1999, in Western Australia State between the small towns of Exmouth and Onslow. A weather station about 35 km (22 miles) south of Exmouth measured one wind gust from Vance at 267 km/h (166 mph); it remains the highest wind speed ever recorded on the Australian mainland. At Exmouth, an extraordinary storm surge of 3.6 meters (11.8 feet) inundated the town's beachfront and severely undermined the marina. At Onslow, the town's lower elevations were flooded by seawater from a storm surge 4 meters high (13 feet), which carried large barges inland.
Vance then traveled 1,500 km (960 miles) across the entire southwestern corner of Western Australia for two days, causing yet more damage before it finally exited off Australia's southern coast.
One Peril, Three Hazards: Cyclone Yasi
Tracy, Wanda, and Vance well illustrate the different hazards that tropical cyclones generate—high winds, inland flooding, and coastal storm surge. Australian insurance policies cover each of these hazards differently—differences that came into play when Severe Tropical Cyclone Yasi made landfall in February 2011 on the Queensland coast about 1,300 kilometers (800 miles) north of Brisbane.
Making landfall as a large Category 5 storm (i.e., with winds higher than 200 km/h [125 mph]), Yasi was the most intense tropical cyclone to strike Australia since 1918.
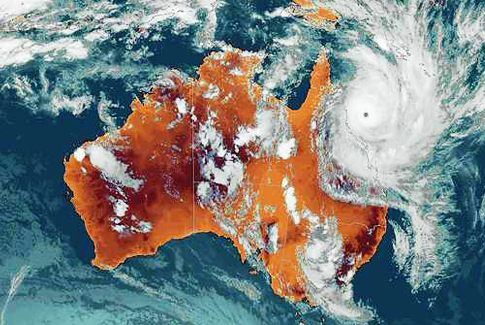
Beachfront hamlets in the area of landfall were hit by a 2.13-meter (7-foot) "tsunami-like" storm surge that pushed as far as 300 meters (950 feet) inland. Townsville, 200 kilometers away and the largest city in the region, received as much as 90 mm (3.5 inches) of rain in one hour; flooding across the region was extensive. And Yasi's winds, in addition to causing widespread damage to buildings, devastated the area's sugar cane and banana crops.
The Insurance Council of Australia estimates insured losses from Yasi to have been more than AUD 1 billion. Broken down according to losses attributable to each hazard, roughly 90% of the insured losses resulted from wind damage, another 8% was from storm surge, and the rest was the result of flooding.
Using Large Loss Scenarios to Test Portfolios
AIR's Australia tropical cyclone model includes a robust 10,000-year catalog of more than 50,000 loss-causing simulated events. A company that suffered high losses from last year's Yasi, for example, might want to test its portfolio against other large-loss events. Figure 4 shows one such scenario.
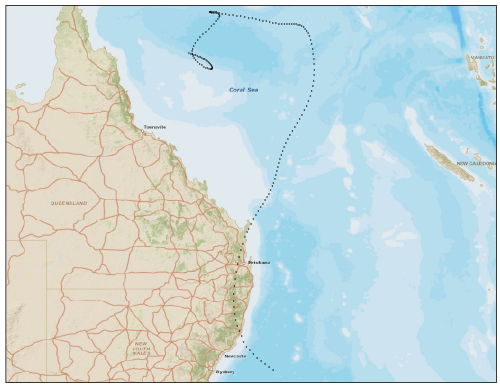
Like Yasi, this event makes landfall in Queensland from the northeast, but 1,300 kilometers (800 miles) farther south—virtually a direct strike on Brisbane. The scenario storm is actually slightly larger than Yasi (about 760 km in diameter [420 miles]) and its maximum sustained winds, at 120 km/h (75 mph), are somewhat lower (a low Category 3 storm on the Australian scale as opposed to a Category 5).
Figure 5 shows where flooding would occur in this scenario. The AIR model estimates that flooding alone would produce about AUD 2.19 billion in industry insured losses.
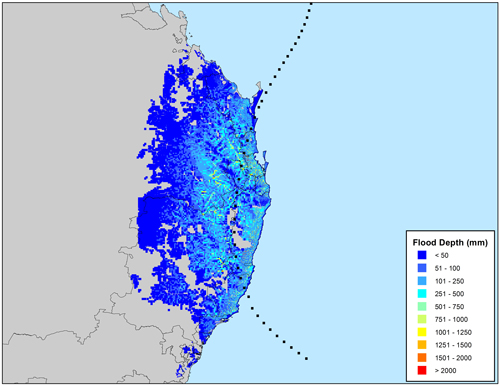
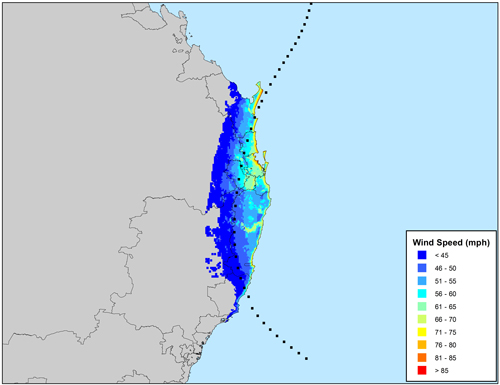
Figure 6 shows the scenario's simulated wind speeds. (Note that in the southern hemisphere tropical cyclones exhibit a clockwise circulation and produce higher wind speeds on the left-hand side of the track.) Wind damage would produce slightly more than AUD 2 billion in insured losses, while storm surge—which reaches heights of 2 meters (6.5 feet) at Victoria Point and Ruby Bay near Brisbane and along the coast at The Narrows near Curtis Island 500 km (300 miles) north of the city—would cause about AUD 82 million in insured losses. Consolidating the losses from all three hazards, this event would cause industry losses of more than AUD 4.27 billion. This is a little more than three times the insured losses caused by Yasi.
Closing Thoughts
A robust modeling of Australia tropical cyclone risk faces unique challenges: frequent storm activity; cyclones that approach from multiple directions and can travel long distances along the country's coasts, sometimes making multiple landfalls along the way; and losses that arise from three different possible hazards. To meet these challenges, AIR researchers have constructed a model that is geographically comprehensive and captures all the dynamic characteristics of wind, flood, and storm surge. In addition, the model's financial module supports the full range of Australian policy conditions—which can vary by peril—thus assuring improved loss estimates.
In modeling Australian tropical cyclone risk, AIR's recently released updated Australia Cyclone Model addresses the region's unique scientific challenges and satisfies the needs of companies charged with managing the risk.
1 The Australian Bureau of Meteorology designates tropical cyclones that have sustained wind speeds above 90 km/h [77 mph] as "severe."
