


European Windstorm Models: Questions You Should Ask
Dec 20, 2012
Editor's Note: European winter windstorm losses, on average, surpass those of any other peril in the region. Against the background of both the approaching implementation of Solvency II and uncertainties introduced by recent model updates, AIR's Senior Vice President for Research and Modeling, Dr. Jayanta Guin, describes what a good winter windstorm model for Europe needs to be able to do and demonstrates how model users can validate their loss estimates.
European winter windstorms impact most of Western Europe, from the Scandinavian countries to southern France—and can wreak havoc deep into Eastern Europe as well. These storms draw their energy not from warm ocean waters, as hurricanes do, but from temperature differences in the atmosphere. This means that, unlike hurricanes, they can not only continue to sustain themselves over land for long distances, but can actually also intensify as they do so, thus causing damage over a wide area.
A Complex Peril
The dynamic atmospheric environment of windstorms is complex—and challenging to model. A model must translate the storms' higher-altitude winds into high-resolution surface-level winds, taking into account highly turbulent movement through all three spatial dimensions as well as time. In addition, winter windstorms over Europe display a pattern of temporal and spatial clustering, a phenomenon that piles complexity on top of complexity.
When updates to established European windstorm models result in unexpected and unexplained changes in loss estimates, as has happened recently, there can be a dislocation in the market. And along with such uncertainty from model change, Solvency II and other regulatory regimes, as they move closer to being implemented, are also putting risk managers under increased pressure to have a more complete and intimate understanding of the models they use.
This is a non-trivial task. A catastrophe model is an intricate, many-faceted tool. Developing such a tool for a complex peril like European windstorms requires a large team of specialized scientists and experienced modelers, who can break the peril down into its constituent parts and then build it back up mathematically, retaining all of its elaborate complexity. As a model user trying to critically evaluate the model, what should you focus on? Unfortunately, it is easy to be diverted by minutiae—drilling down to precise wind speeds at specific locations, for example—while losing sight of validation basics, such as how well the model's results capture the actual frequency and severity of losses.

By: Dr. Jayanta Guin
Edited by Robert Zalisk
The article: Outlines how the intrinsic complexity of European winter windstorms should be captured and provides probing questions and procedures by which the model can be validated.
Highlights: The efforts taken to develop an accurate and comprehensive meteorological database for Europe are described, and also the mathematical and engineering procedures used to model windstorm clusters, wind intensity at the ground, and European regional vulnerabilities. Average annual loss—actual and modeled (using France as an example)—is examined in an exercise that demonstrates modeled loss validation.
Model Requirements
This article provides some specific questions that risk managers should ask in order to understand their European winter windstorm models better, and also discusses how the output of catastrophe models can be validated. With respect to judging a model's general robustness, users should ask:
- Does the model's representation of the peril obey the basic principles of physics that underlie these storms and appropriately capture their impact on the built environment; and can each model component be independently validated?
- Does the model give consistent and broadly accurate results when tested against a wide range of historical data sets?
- Does the model produce reasonable and unbiased loss estimates for actual events in real time?
Interrogating Your Model
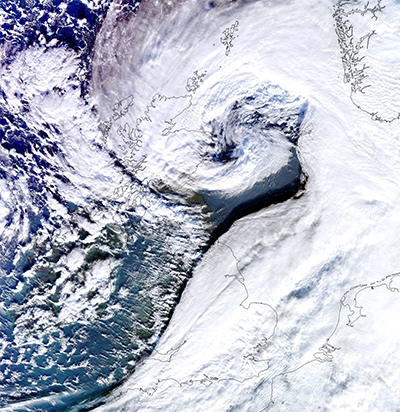
Figure 1 shows Windstorm Ulli, the first European winter windstorm of 2012. The storm fills the North Sea between Scotland and Norway and plainly shows the characteristic comma-like shape of a winter storm. The perceptible flow of the clouds and the contours of that movement also suggest the complexity of the storm's structure that is hidden within. Familiarity with a model begins here: Is the structure of winter storms and the forces that drive them appropriately captured in the model?
The first step is to clarify the definition of a winter storm (more commonly called extratropical cyclones, or ETCs, by scientists and modelers) in the context of the model. This is especially necessary because a data set of well-researched and accepted "ETC best tracks" (comparable to HURDAT for Atlantic hurricanes) does not exist for European winter windstorms. The AIR Extratropical Cyclone Model for Europe begins its determination of which weather events can properly be considered to be an ETC by processing "reanalysis data." Reanalysis data is an extensive database managed by a government/academic/private sector consortium consisting of the National Centers for Environmental Prediction and the National Center for Atmospheric Research, or "NCEP/NCAR." It is a continually updating gridded data set that reflects the constantly changing conditions of the earth's atmosphere worldwide; it includes satellite and other observation data and the output of "numerical weather prediction" (NWP) models going back to 1948.
Using the reanalysis data and NWP technology to identify storms by their vortex centers, AIR has determined that, on average, between 70 to 90 storms pass over Europe every winter season—a number consistent with that of Freie University in Berlin, which is responsible for naming these events. (There were 71 such meteorological events between October 2011 and March 2012.) Most of these are low-energy events, which lack the potential to cause significant damage and loss, and these are filtered out of the model's catalog, leaving 5.3 ETC events per year, on average.
Clustering
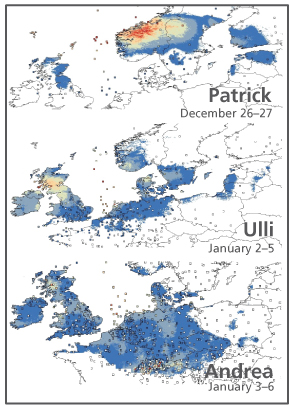
NWP technology also enables us to produce an accurate determination of the time sequence of the storms' arrival over Europe. One of the distinctive features of ETCs in Europe is that even though they form over the western North Atlantic Ocean at a more or less regular rate, they have a tendency to arrive over Europe in clusters, one storm following another in close sequence (a frequency different from their genesis frequency and shorter than chance alone would suggest). This phenomenon is illustrated in Figure 2, which shows the arrival of the ETCs Patrick, Ulli, and Andrea in the 2011/12 season, all within a 10-day period.
Using a statistical modeling technique known as "temporal block bootstrapping", AIR was the first modeler to explicitly model the ETC clustering phenomenon. It is necessary to account for clustering precisely because it is a natural characteristic of these storms' behavior—and consequently has major implications for estimating the risk associated with their occurrence. Thus, treating clustering as "optional" within the model is not defensible.
In summary, with respect to event characteristics within an ETC model, model users should ask:
- What historical database of storms is used in your model and how is it used?
- Does your model produce clustered ETC events in space and time?
- How do clustered ETCs impact your business?
- Does your model output closely match the frequency of loss-causing storms in Europe?
How Is Storm Intensity Determined?
NWP techniques provide the most effective tool by which the movement and changing shape and contours of ETCs as they pass over Europe can be modeled. A good ETC model, however, must be able to produce consistently realistic wind speeds at ground level—which is where damage occurs. Because the winds from an NWP model are at relatively coarse resolution and better represent winds aloft than winds at the surface, the AIR model employs physical and statistical downscaling operations to refine surface winds to a 1 km x 1 km resolution. Physical downscaling accounts for local terrain characteristics like surface roughness and topography at a scale not resolved by the NWP results, while statistical downscaling develops a relationship between NWP output and actual weather station ground-level observation data.
Station data are then used to validate the high-resolution downscaled wind speeds. To assemble the database, the AIR research team gathered four decades of time-series data from more than 800 weather stations across Europe, event-specific observations from nearly 1,100 stations, and real-time hourly wind observations from more than 500 METAR (METeorological Aerodrome Report) stations. Other data sources include various global data sets such as the Integrated Surface Hourly (ISH) data set, country-specific meteorological agencies such as Metéo France and the German Met Office, and private vendors. But raw data is not error free. AIR spent months cleaning the data and converting them to a consistent scale.
A clean and consistent observation data set is essential to reliable model results—because damage is extremely sensitive to small changes in wind speeds, as demonstrated in Figure 3. Figure 3 compares reported and AIR-modeled insured losses for the historical event set of European ETCs included in the AIR software (which compare very favorably) to modeled losses when an upward bias in the wind speeds of just 5% is introduced.
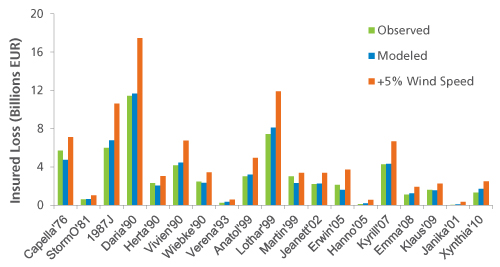
The losses estimated from the modestly heightened wind speeds—shown in red—in every instance are significantly increased; in the case of Daria, for example, by more than 50%. The reason is that the relationship between damage and wind speed is not linear.
Therefore, model users should confirm that their models make use of similarly optimized surface wind speed databases. They should ask:
- Which reference historical data are incorporated into the model?
- Have the known challenges that raw observation data present been properly resolved before loss validation has been undertaken?
- Have the latest science and mathematical techniques been used to simulate the surface wind fields in my model?
- How closely do my model's ETC surface wind fields match those of the empirical record?
How Is Vulnerability Addressed?
Minor biases or oversights in calibrating the model's damage functions can similarly result in large loss distortions. The impact of ETCs generally leads to a high frequency of claims that have low severity. Engineering models do not adequately account for damage at these low severity levels—so both on-the-ground site damage evaluations and extensive claims data analyses are also needed to develop reliable and robust ETC damage functions.
In developing damage functions for the AIR ETC model for Europe, AIR researchers used data gathered from detailed damage surveys of all the major winter windstorms in Europe, from ETC Anatol (in 1999) to ETC Xynthia (in 2010), along with extensive analyses of EUR 3 billion in claims data from 12 historical events spread over 20 years (ETC Daria to ETC Xynthia). In addition, regional differences in vulnerability within Europe were explicitly captured.
From northern Norway to southern France to eastern Poland, geography, climate, and wind patterns differ. Over the centuries, these differences in storm climate have produced differences in building practices—and thus differences in building vulnerability. For example, two buildings described in an insurer's portfolio as being exactly the same—each a two-story masonry residential structure, for example—would have different vulnerabilities (because of local construction practices, locally available materials, upkeep traditions, building codes, etc.) if one were located in the south of France and the other in Scotland. These regional differences are readily apparent in claims data. Figure 4 shows Europe's regional vulnerability as captured in the AIR model.
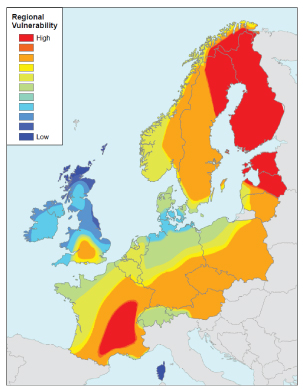
The regional vulnerability is based primarily on the design wind speeds provided in European building codes that began to be unified as "Eurocodes" in the 1990s. Figure 4 shows that Europe's highest vulnerabilities are in southeastern France, where building codes use lower design wind speeds than in areas like Scotland, where very high wind speeds are common.
With respect to the vulnerability component of the model, model users should ask:
- Have the modeled wind speeds been well validated with observation? If not, independent validation of the vulnerability component is not possible.
- Does the model capture regional variations in vulnerability?
- Has exposure in force at the time of an event been used for validating the model against actual losses?
- Has exposure been coded properly (occupancy, construction, coverage) when running an analysis?
Finally, be alert to the fallacy of validating the model based on good or bad matches to a small sample of storms.
The Bottom Line: Do the Losses Make Sense?
How does one go about validating modeled possible future losses against limited loss experience data? A good place to start is with modeled average annual loss (AAL) and low return period losses. When these metrics cannot be validated, it indicates that other parts of the model's exceedance probability (EP) curve may also be problematic, especially at higher return periods (events that have a lower probability of occurring, but that incur very large losses when they do).
The average annual loss (AAL) produced by a model is the mean of a highly skewed probability distribution (the EP curve). As such, the AAL from a company's loss experience, which generally is based on a short historical record, should actually not be expected to match the modeled AAL. If it does so, it is only by chance.
Take, for example, the case of a hypothetical company in France. The company's actual AAL over the past 35 years—based on 16 major historical storms that have impacted France in that time—comes to EUR 36 million (based on today's exposures and policy conditions), as shown in Table 1. For this example, the AIR model produces an AAL of EUR 58 million for the company—which at first glance would appear to be an overestimation of the risk.
| 16 Historical Storms (based on today's industry exposure) |
AIR Model | |
|---|---|---|
| AAL (EUR million) | 36 | 58 |
Recall, however, that the AIR modeled AAL is the mean of the entire EP curve. Thus, it is necessary to take into account the contributions of all parts of the EP curve to the model's AAL estimate. Figure 5 shows the loss contributions at common locations along the company's EP curve.
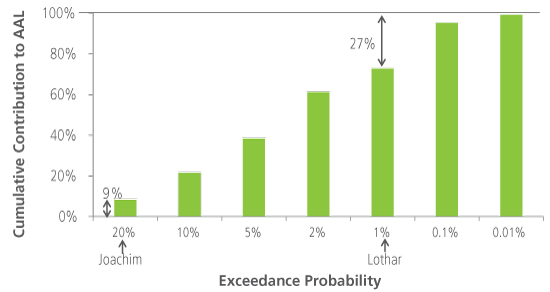
The loss exceedance probabilities for the 16 major historical catastrophe events all fall between about 20% (5-year return period) for Windstorm Joachim, up to 1% exceedance probability (100-year return period) for Lothar. Losses from more common (and therefore more probable)—but less damaging—events than Joachim contribute about 9% to the total AAL, while losses that have a return period longer than 100 years (probabilities of 0.1% or even 0.01%) contribute as much as 27% to the modeled AAL.
If we calculate a modeled AAL only for the portion of the EP curve between the 20% and 1% exceedance probabilities—that is, remove the contributions of the low return period losses (up to 5 years) and the high return period losses (above 100 years)—the modeled AAL becomes EUR 37 million, very close to the historical AAL of EUR 36 million.
| 16 Historical Storms (based on today's industry exposure) |
AIR Model | AIR Modeled (5-yr to 100-yr) |
|
|---|---|---|---|
| AAL (EUR million) | 36 | 58 | 37 |
Similar exercises can be performed by risk managers on their own portfolios so that they can validate their modeled losses and become more familiar with their models and the way they work. In this regard, model users should ask:
- Do your modeled losses make sense?
- Are the events in the tail of the EP curve meteorologically realistic and credible?
- As a pan-European (re)insurer, does your model's spatial (across countries) correlation of risk make sense?
Closing Thoughts
As recent catastrophes—such as the Tohoku earthquake last year and, most recently, Hurricane Sandy—have shown, our industry needs to be prepared for the unexpected. For Europe, the next "surprise" could be multiple large and intense winter storms that impact major metropolitan areas in a single season—that is, a season even more extreme than was experienced in either 1990 or 1999. As an industry, we need to expend the effort and make the necessary investments that will allow us to become better risk estimators and risk managers.
This article has presented some very important questions that need to be asked and answered during the model evaluation process—and has also highlighted some of the chief factors necessary to understanding specifically winter windstorm risk in Europe. A robust catastrophe model needs to be thoroughly validated using multiple data sets. It should obey basic physical and engineering expectations concerning the underlying hazard. And, most importantly, the modeled losses need to make sense.
AIR makes major and ongoing investments to improve our models and our modeling practices. The AIR Extratropical Cyclone Model for Europe provides an empirically based and consistent view of windstorm risk that clients can trust.
