


Managing U.S. Severe Thunderstorm Risk: Part 3, Quantification of the Risk and Ratemaking Considerations
May 18, 2022
Editor's Note: Verisk plans to release a substantially updated severe thunderstorm model for the United States in summer 2022. This article is the third and final one in our series on managing U.S. severe thunderstorm risk. Part I discussed newly available data, technological advances, and the importance of capturing all severe thunderstorm outbreaks to successfully manage this risk. In addition, we discussed the impact of climate change on the severe thunderstorm peril. In Part II we discussed our innovative and first-of-its-kind Hail Vulnerability Framework and how our updated model can distinguish the view of risk from one property to another. In Part III we discuss the countrywide risk and our Verisk-wide approach to looking at the cat and non-cat risk, our validation methodology, and how you can use your own claims experience with our model to form your own view of risk.
Severe thunderstorm ranks among the highest loss-causing perils in the United States. While the most publicized storms may be long-lasting and affect more than one state, more localized severe thunderstorms of shorter durations occur regularly across the contiguous United States and the cumulative effect of these storms can lead to significant insured losses. In 2020 and 2021, countrywide severe thunderstorm insured losses totaled values that had not been seen in the recent past, except for the infamous 2011 season, according to Verisk’s Property Claims Services® (PCS®). The 20-year trended loss average prior to 2020 was less than USD 20 billion. On an annual aggregate basis, severe thunderstorms account for more than one half of all insured catastrophe losses in the United States, as shown in Figure 1. Figure 1 also shows the average annual proportion of industry insured losses attributed to severe thunderstorm events among other perils, including tropical cyclones, earthquakes, wildfires, and winter storms, as reported by PCS. On average, 55% of annual reported industry insured losses have stemmed from severe thunderstorm events since 1985. These statistics still hold when we look at averages after the year 2000.
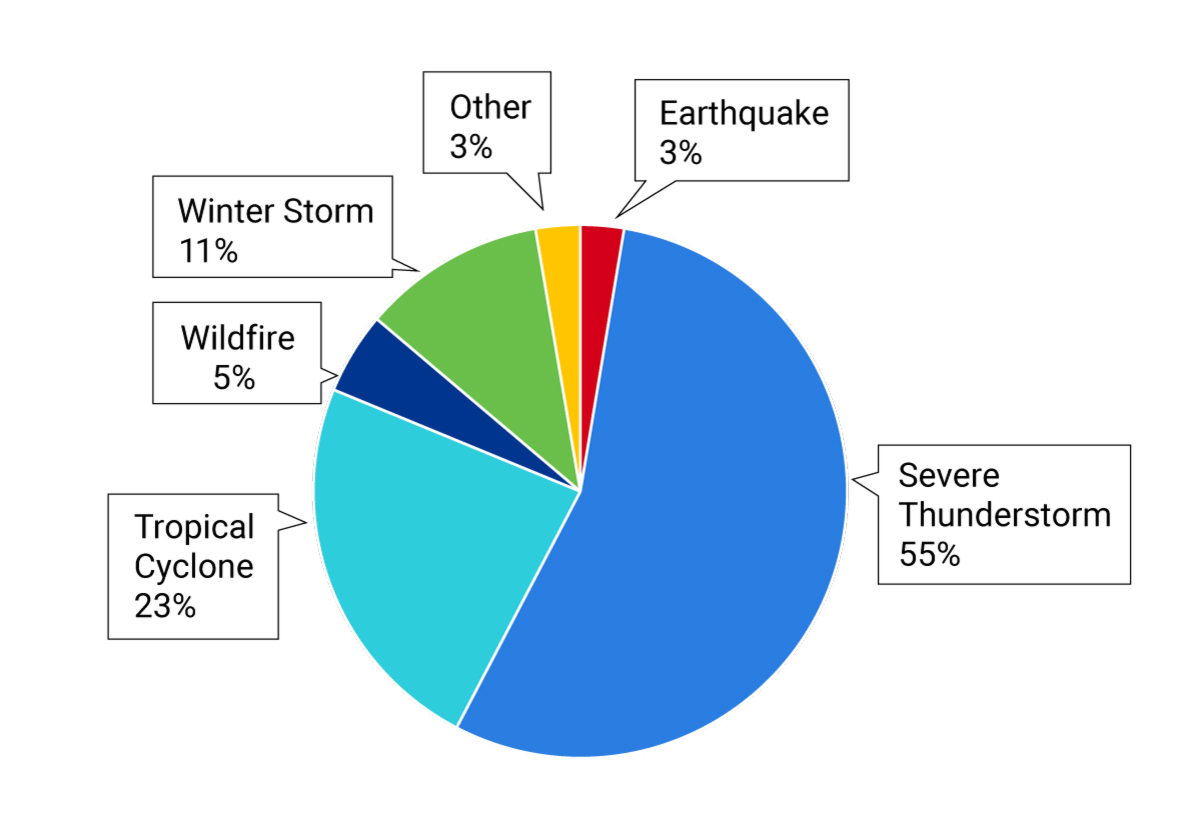
While 55% is a staggering contribution when it comes to severe thunderstorms, you should note that PCS does not capture and report industry insured loss estimates for all severe thunderstorms. PCS only captures losses from those severe thunderstorm outbreaks that inflict losses greater than USD 25 million to the industry. Detailed claims data from Verisk Property Estimating Solutions help us estimate what portion of losses are attributable to severe thunderstorms beyond those reported by PCS. This is particularly notable in that insured catastrophe losses are increasing as a percentage of total (catastrophic and non-catastrophic) loss over time. Based on these claims data, valued at more than USD 200 billion over the last two decades, approximately 52% of severe thunderstorm losses can be attributed to non-PCS severe thunderstorm outbreaks.
In this article we discuss U.S. severe thunderstorm risk from several perspectives: countrywide and regional views; and we further dissect it by sub-peril. We also provide insights for you into how Verisk’s modeled risk compares to industry benchmarks and discuss ratemaking methods using the updated Verisk Severe Thunderstorm Model for the United States, anticipated for release in summer 2022, in a case study to illustrate why it is particularly suitable for your rate-making needs.
Countrywide View of U.S. Severe Thunderstorm Risk
The Verisk Severe Thunderstorm Model for the United States simulates losses resulting from straight-line winds, hail, and tornadoes on insured properties in the lower 48 states plus Washington D.C. Daily activity is simulated based on realistic historical occurrence rates and location- and season-specific weather patterns. Throughout this process the model is able to capture the impact of large atmospheric systems as well as the highly localized effects of individual hailstorms, windstorms, and tornadoes on exposure. The engineering component of the model relates the hail, straight-line wind, and tornado hazard intensity from each event to physical damage at the exposure location through the application of the respective coverage-specific damage functions. Damage is then translated to physical loss through the model’s financial module, which determines gross losses by applying coverage-specific policy conditions to the respective ground-up loss estimates.
Industry insured loss estimates are only as reliable as the exposure data that is input into the model. Verisk’s industry exposure databases are country-specific databases containing risk counts for insurable exposures along with their respective coverage-specific replacement values, physical attributes, occupancy characteristics, and unique peril-specific policy terms and conditions. Economists, engineers, demographers, and statisticians at Verisk developed a high-resolution industry exposure database for use in the U.S. severe thunderstorm model using data from both government and private vendors. This high-resolution 90-meter gridded database is able to capture the sophistication and detail available not only in the built environment but also in the updated hazard component of the model. Here we’ll leverage the U.S. industry exposure database to present you with the industry insured view of severe thunderstorm risk across the country.
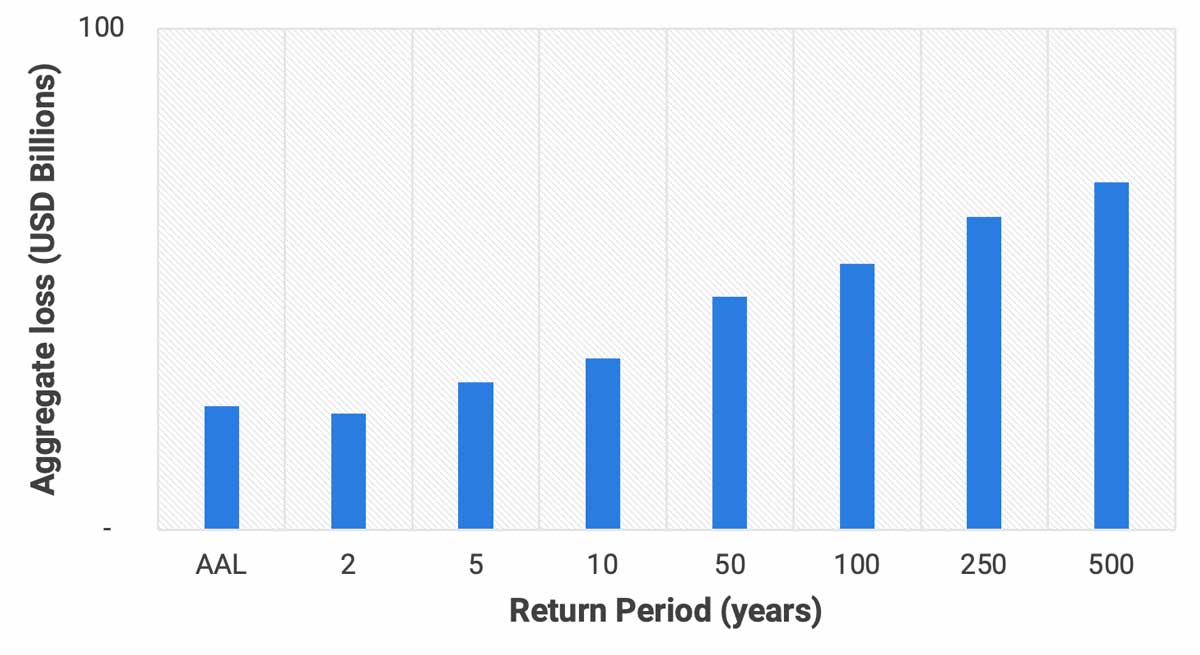
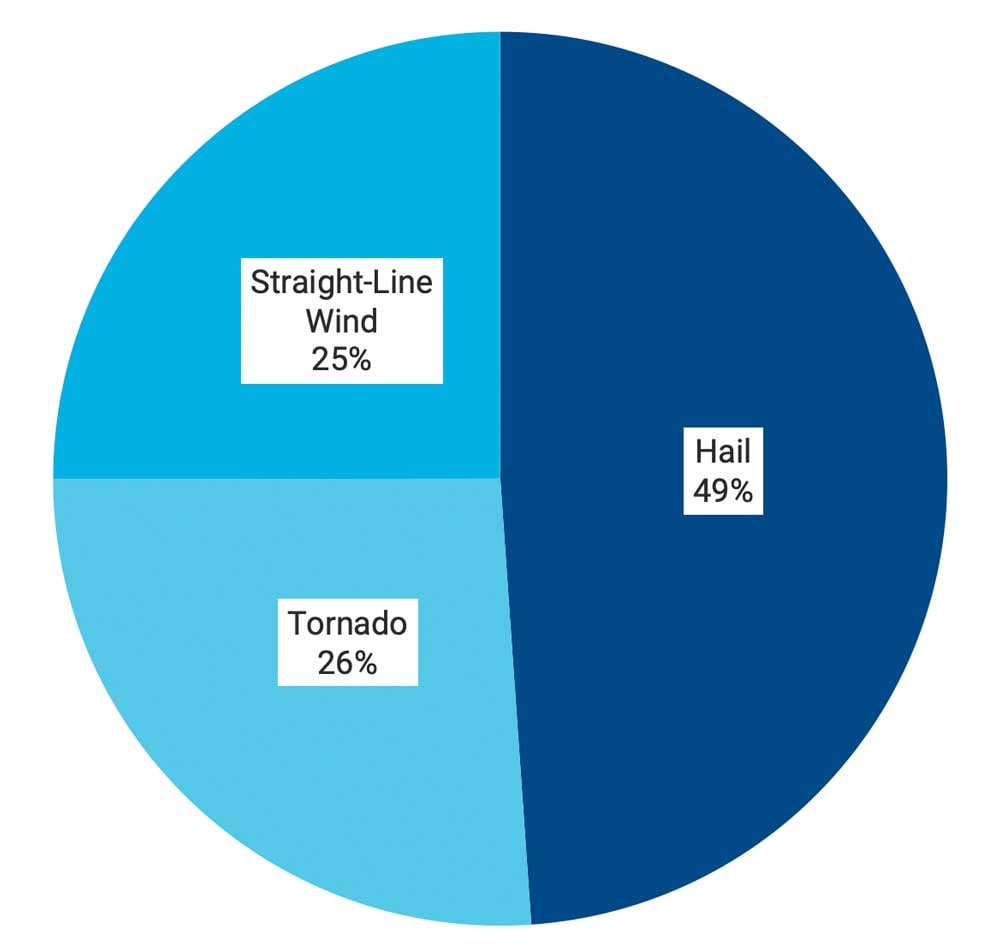
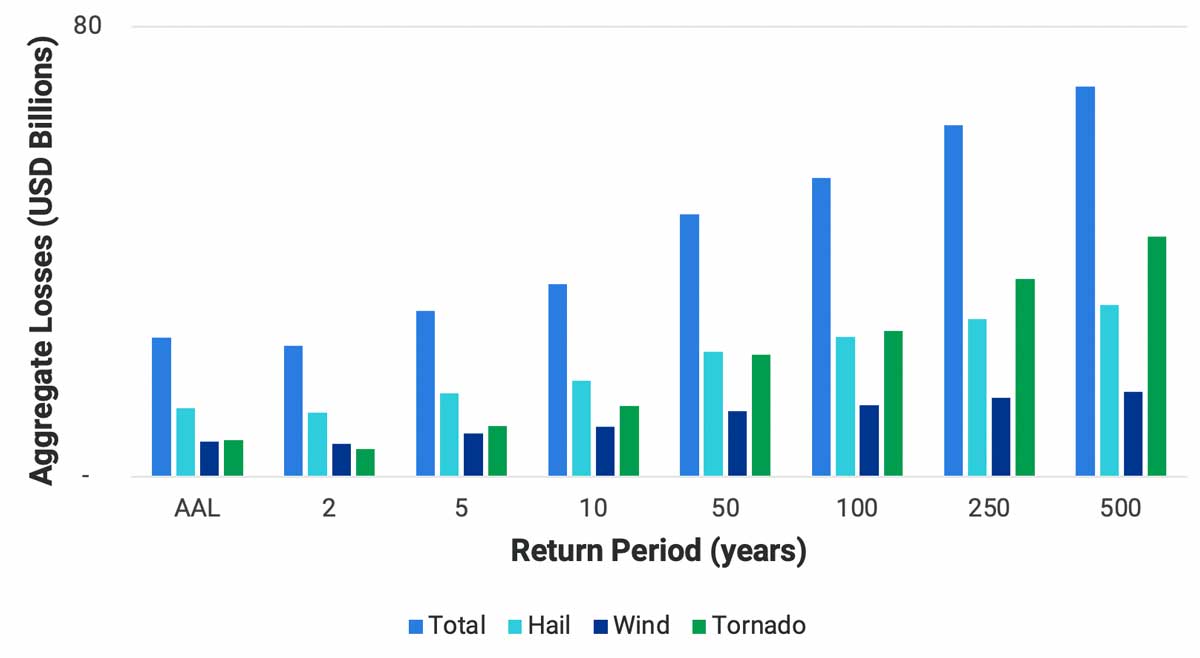
Verisk estimates that the insurable gross aggregate average annual loss (AAL) in the contiguous United States from hail, wind, and tornado resulting from all severe thunderstorm events is approximately USD 25 billion. Figure 2 shows the exceedance probability curve for the contiguous United States across all sub-perils, and Figure 3 further breaks down the AAL into the sub-peril contributions from hail, wind, and tornado. For the contiguous U.S., hail contributes roughly half of the aggregate AAL whereas tornado and straight-line wind account for roughly a quarter each.
 Stacey Gotham, FCAS, MAAA, CEEM
Senior Actuary
 Sarah Bobby, PhD
Senior Engineer
 Karthik Ramanathan, PhD
Vice President
Edited by Sara Gambrill, CEEM
U.S. Severe Thunderstorm Risk by Sub-Peril and Region
While countrywide metrics, such as those shown in Figures 2 and 3, provide you with a general overview of the severe thunderstorm risk in the United States, if we drill down a bit we can see that different sub-perils dominate losses in different parts of the country. Hail is most common in mid-latitude regions and along mountain ranges in the late spring and summer, occurring most frequently throughout the central Great Plains. Although tornadoes can affect any state, they are particularly common in “Tornado Alley,” which includes the Missouri, Mississippi, and Ohio river valleys as well as regions in Texas, Nebraska, Kansas, and Oklahoma. While Mississippi, Alabama, Georgia, and Tennessee also commonly see tornadoes, this region exhibits a wider degree of variability in tornado activity. Tornadoes can also occur any time of year, but they more commonly occur between April and June. Severe straight-line windstorms, on the other hand, are seasonal. From May through August, these commonly form in the upper Mississippi to Ohio river valleys and from the mid-Mississippi River Valley to the Southern Plains. From September through April severe windstorms are more frequently seen in Texas and the Southeastern United States. Thus, the sub-peril contribution to losses varies by region. Figure 4 shows the sub-peril contribution to the gross aggregate AAL by region, revealing that:
- Hail losses dominate the West, northern and southern Great Plains, and Midwest
- Tornado tends to contribute to higher losses in the Southeast and Florida
- Straight-line wind events contribute to higher losses in the Northeast
Your individual portfolios might not reflect these same loss patterns, depending on the regions in which your exposures are concentrated.
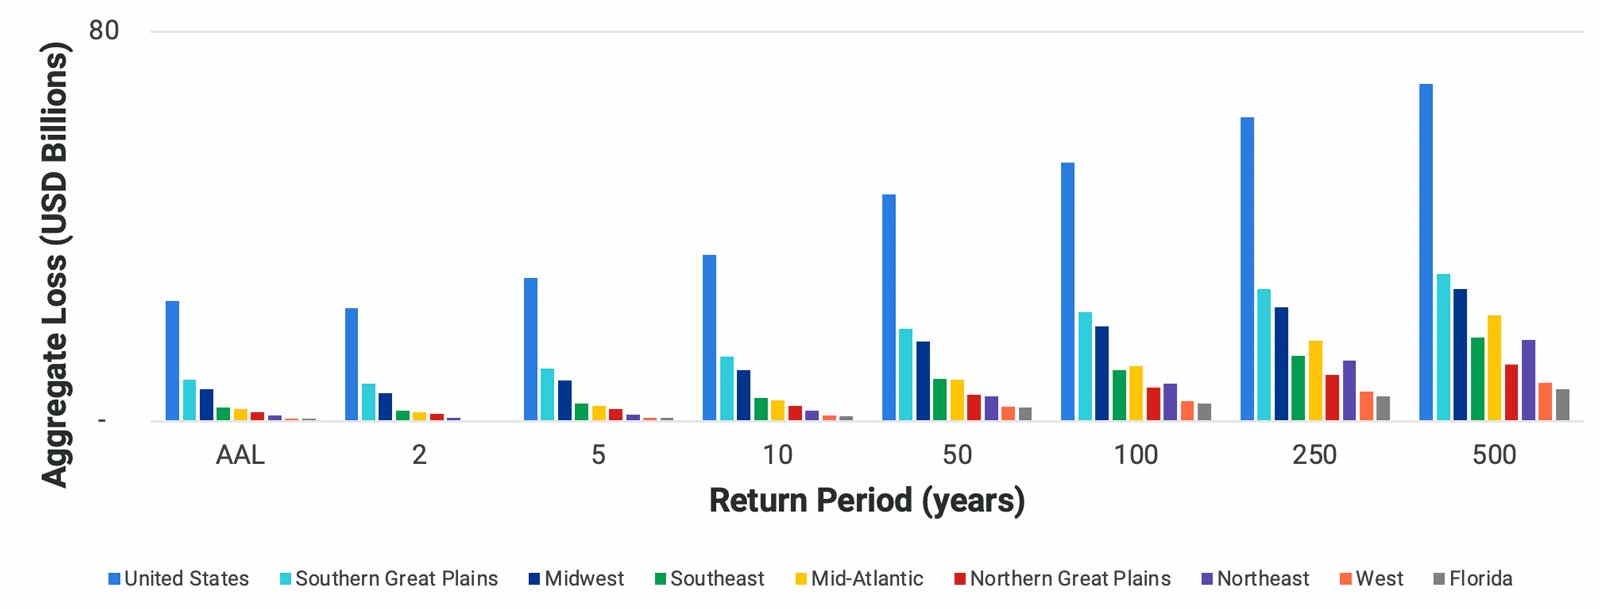
It’s clear from Figure 4 that hail significantly contributes to the aggregate AAL in most regions. While hail occurs quite frequently and it is possible to have significant losses from this peril at low return periods—making it the dominant peril—the dominant peril signature changes as we move toward the tail of the exceedance probability (EP) curve. Figure 5 illustrates the total and sub-peril based gross aggregate EP curve for the contiguous United States. While hail losses still contribute significantly across all return periods, tornado events tend to dominate the tail of the EP curve. We also see shifts in regional dominance at higher return periods as shown in Figure 6. While the southern Great Plains and Midwest contribute a significant amount at both the low and high return periods, the Mid-Atlantic and Northeastern regions see significant losses at higher return periods as tornado tends to dominate the tails of the exceedance probability curves.
A Holistic, Granular View of Severe Thunderstorm Risk Is Critical to Sound Pricing
The use of a long-term historical average in ratemaking—while valuable for addressing the inherent variability of insured losses—will not adequately capture experience in the tail of the distribution, or loss from rare events. Nor will it help in adequately capturing the near-present climate, as climate change is expected to continue to increase the length of the severe thunderstorm season on both ends as well as to extend northward the area where such activity can occur. More U.S. states could be impacted by severe thunderstorms earlier and later in the year. The most recent years’ experience may be a better guide to what we can expect in the future, but a shorter historical record will reduce the ability to reflect the tail of the distribution. Adequately reflecting the tail of the distribution in ratemaking and procuring reinsurance are paramount.
Sound pricing requires rates that cover tail scenarios at an appropriate granularity. Verisk’s extreme event models are particularly well suited for this because they provide a stable view of risk that represents tail risk at appropriately low levels of exceedance probability while providing a more accurate view of risk for the entire distribution, given the calibration of the updated model based on a wealth of claims and industry insured loss data (see next section for more on Verisk’s data). For instance, in the State of Texas, trended industry insured historical losses, shown in Figure 7, during the period 2000 to 2019 averaged USD 3 billion. Also shown is the 5-year moving average, which steadily increases over these two decades.
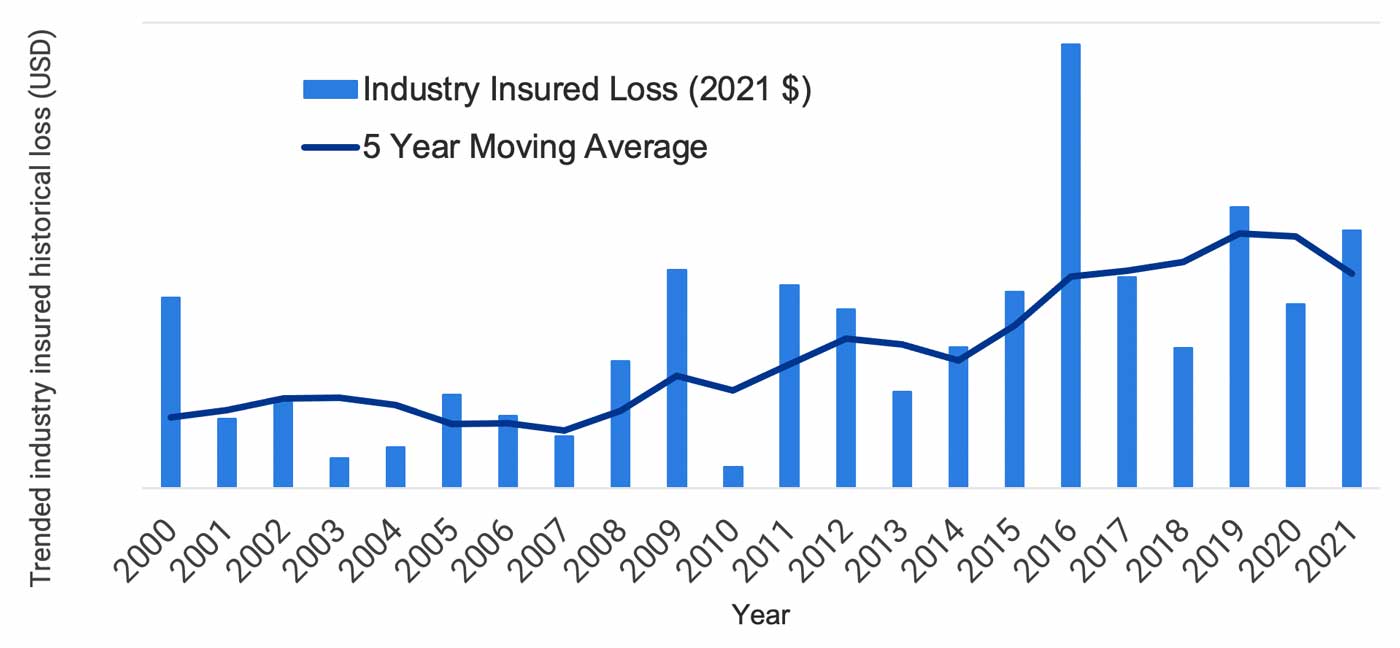
Industry insured losses in 2020 and 2021 were more than USD 5 billion each, arising from 18+ events in both years. Although not shown in these figures, the trended industry insured historical losses for 1998 and 1999 were lower than those observed in 2018 and 2019. Consequently, the most recent 20-year historical period of PCS wind losses available would have resulted in an inadequate loss provision in rates for 2020 and 2021 for a company writing a representative portion of the state. Year-to-year fluctuation is expected in catastrophic loss amounts; however, a few potential advantages of using modeled losses and/or scenarios where modeled losses may be required to adequately rate are listed below.
- The long-term PCS losses are based on exposure distributions that are no longer representative. The ultimate goal of a catastrophe model is to faithfully represent the risk everywhere—even in locations where exposure does not exist today—because it may exist tomorrow. Modeled losses reflect current exposure distributions.
- The risk posed by the severe thunderstorm peril is different than the risk in the historical period due to changes resulting from climate change, for instance. Detrending the historical SPC data, along with the use of reanalysis data sets and radar data sets over the past several decades provides a view of the severe thunderstorm risk in the U.S. in the near-present climate.
- Even in the absence of problems with historical data such as those outlined above, using a model provides actuaries and risk managers with intuitive, readily available metrics to use in determining a risk load.
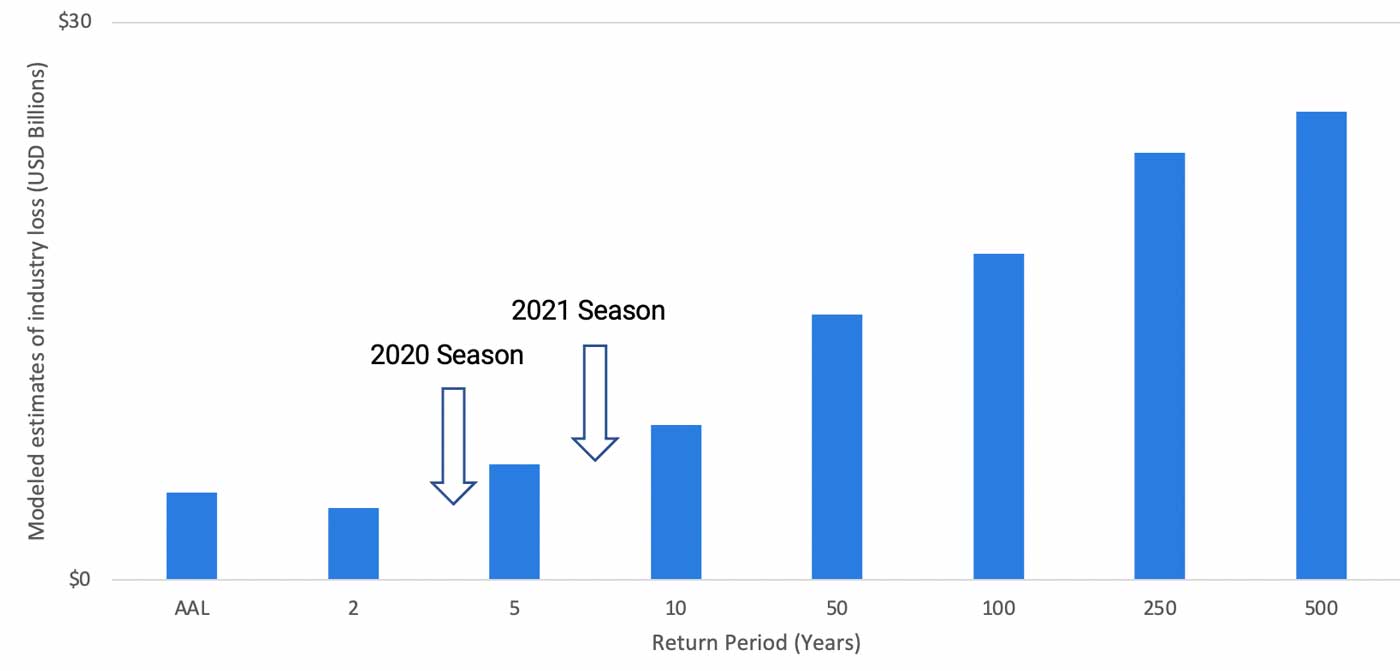
Figure 8 displays the industrywide cat-only aggregate exceedance probability curve for Texas from the Verisk Severe Thunderstorm Model for the United States. The updated model incorporates the most recent data and scientific knowledge as well as radar data, providing a comprehensive near-present view of risk. Benchmarking the industry losses for the 2020 and 2021 severe thunderstorm seasons attributes a return period above 5 years and below 10 years, which realistically estimates this risk as well as the risk of more extreme scenarios further out in the tail.
The modeled average annual losses for pricing in Texas are significantly higher than the long-term average, as the tail is incorporated into the average. Furthermore, losses at various return periods are readily available for you to use in a risk load reflecting the inherent variability and therefore risk in catastrophic risk experience.
The model not only provides you with a holistic view of the potential losses that can be expected in the future but can also offer insight into what components of the portfolio are driving severe thunderstorm risk. The model can also help you evaluate where accumulations of risk are located, where to grow and retract business, whether to change the portfolio's mix of lines of business, and how to optimize the usage of wind pools. The model is commonly used to structure and place reinsurance programs and can be brought directly into the underwriting process for individual accounts.
As will be discussed in more detail in later sections, Verisk model results can also be used in developing sound pricing. Before then, we’d like to discuss the data that goes into our U.S. severe thunderstorm model, as your pricing of severe thunderstorm risk can only be as sound as the data input into the model you use.
Benchmarking and Validation: Ensuring Your View of Risk Is Realistic and Reliable
Verisk has a wealth of claims and loss data that we used to validate our view of risk. As part of this effort, we developed benchmarks based on industry losses and validated against these benchmarks. For severe thunderstorm events we gained access to aggregate industry insured loss data from Verisk’s PCS. This data is aggregated by state and summarized by line of business from 1998 onward. As stated earlier, PCS does not capture and report industry insured loss estimates for all severe thunderstorm events. PCS only captures losses from those severe thunderstorm outbreaks that inflict losses of greater than USD 25 million to the industry, which PCS defines as “cat” events.
We also have detailed industry Verisk claims totaling more than USD 160 billion, which include both events classified as “cat” by the industry, as well as non-catastrophe or “non-cat” lower loss events.
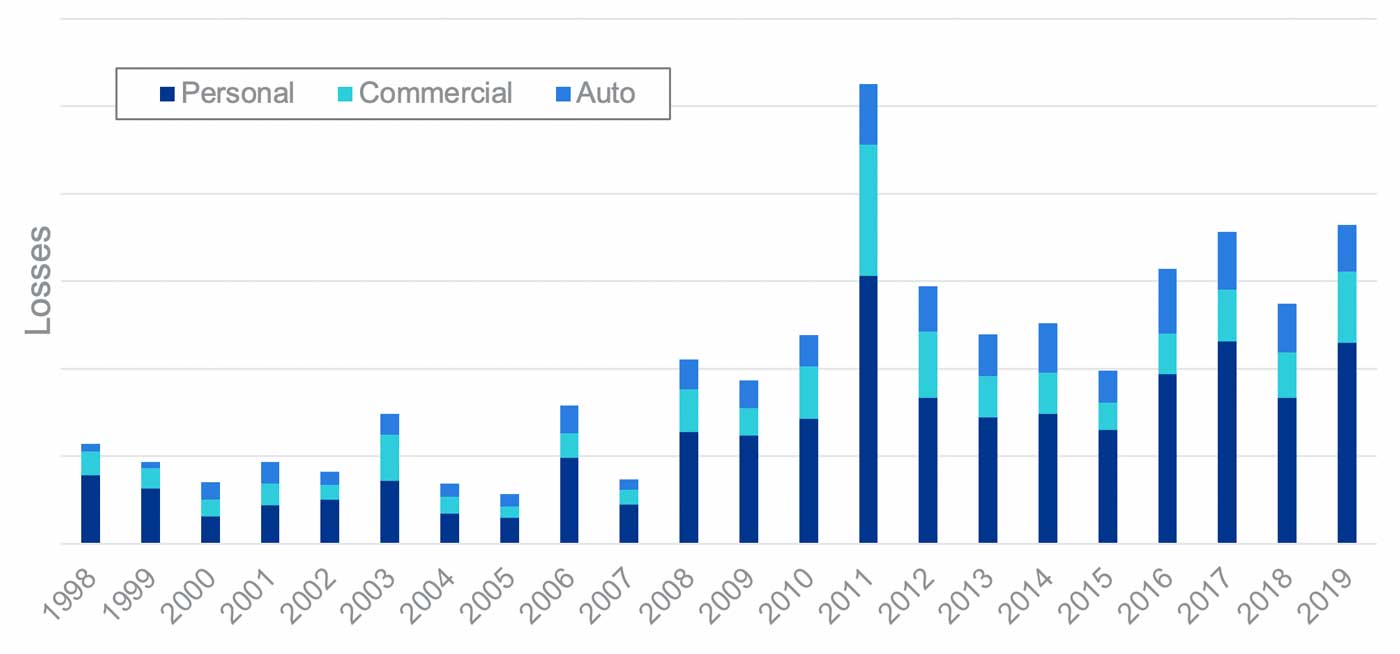
As with any data set, a significant amount of processing needs to be done to transform it before it can be used for model validation and benchmarking purposes. While hurricanes and tropical storms, are readily identified within the PCS data set, losses from severe thunderstorm and winter storm events are collectively represented under one category. An event attribution algorithm is formulated to attribute losses to severe thunderstorm, resulting in a subset of events as shown in Figure 9. Once we obtain the set of severe thunderstorm events, the next step is to index or trend the losses to modern-day dollar values.
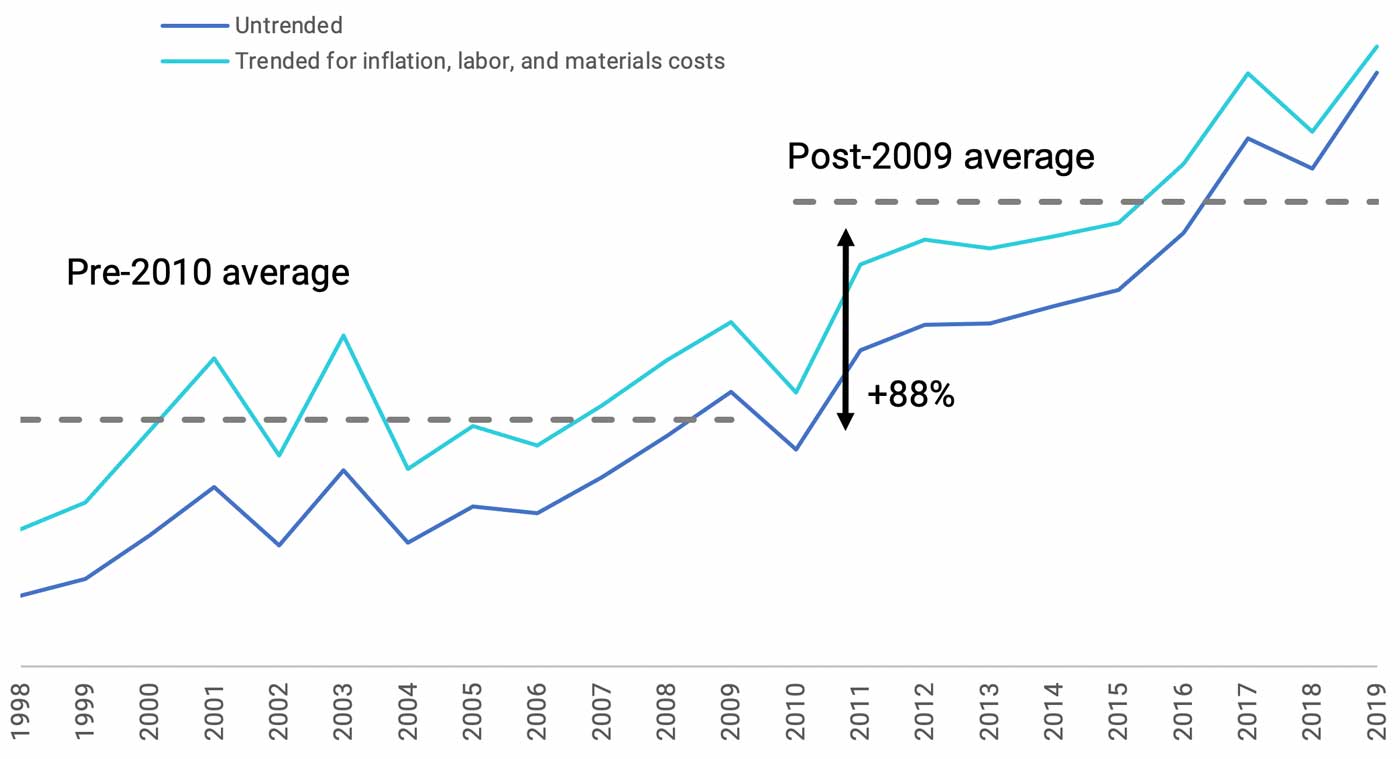
Trending losses from older years to today’s value is an area of active research; numerous researchers have proposed novel techniques. There is some uncertainty associated with this and to represent this uncertainty, researchers at Verisk trend losses using two different approaches. The first approach considers inflation, wealth, and changes in exposure at the state level. Inflation adjustments are based on the implicit price deflator for the gross domestic product from the Bureau of Economic Analysis. Wealth adjustments are determined using the median home value, and exposure growth is assessed using the number of housing units. The second approach trends losses to account for exposure growth, change in labor and materials costs, and inflation. Figure 10 shows the original and trended average residential severe thunderstorm claim values by year in Texas based on data from Verisk PCS, using the second approach.
After accounting for the aforementioned factors, trends were still apparent in the loss data post-2009 for select areas and lines of business, despite any evidence that severe thunderstorms are particularly severe in the post-2009 time frame when compared to events that happened prior to 2009. This additional trend seen in claims may be attributed to several different factors, including changes in claims settling practices, changing policy structures, claiming behavior by insureds and contractors or others, which required the development of a supplementary trending methodology to remove these artifacts. The inflation, growth, cost, and supplementary trending aspects are all subject to uncertainty; this was accounted for during the benchmark creation process. After trending, the data set could be used to evaluate cat losses but was still missing the non-cat component needed to validate an all-events model.
Verisk’s detailed daily industry claims data held the key to obtaining this non-cat component. The processing efforts described in the case of PCS data is very much applicable to these detailed claims as well. Similarly, it was necessary to strip the data set of all losses associated with events other than severe thunderstorm and trend the individual claims to current year monetary values. Date and cause of loss information was available for each claim and was used to separate the industry data into two components: a cat component, which included those events that were classified as a PCS event and therefore considered “cat” by the industry; and a non-cat component, which consisted of all other severe thunderstorm events. Using this data we were then able to evaluate the portion of the total loss in each state considered cat and non-cat; we used this information to scale up the trended aggregate industry losses from PCS to also account for the non-cat contribution to obtain the final “all-events” benchmarks. Figure 11 provides these benchmarks for the average annual loss for various lines of business.
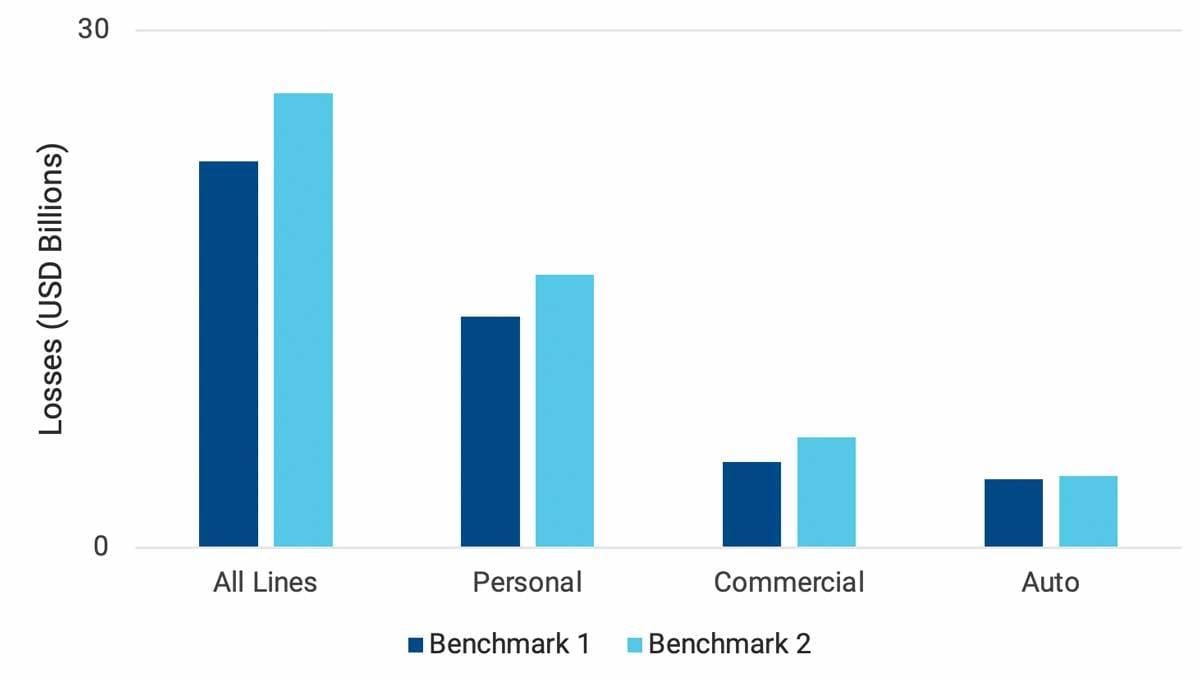
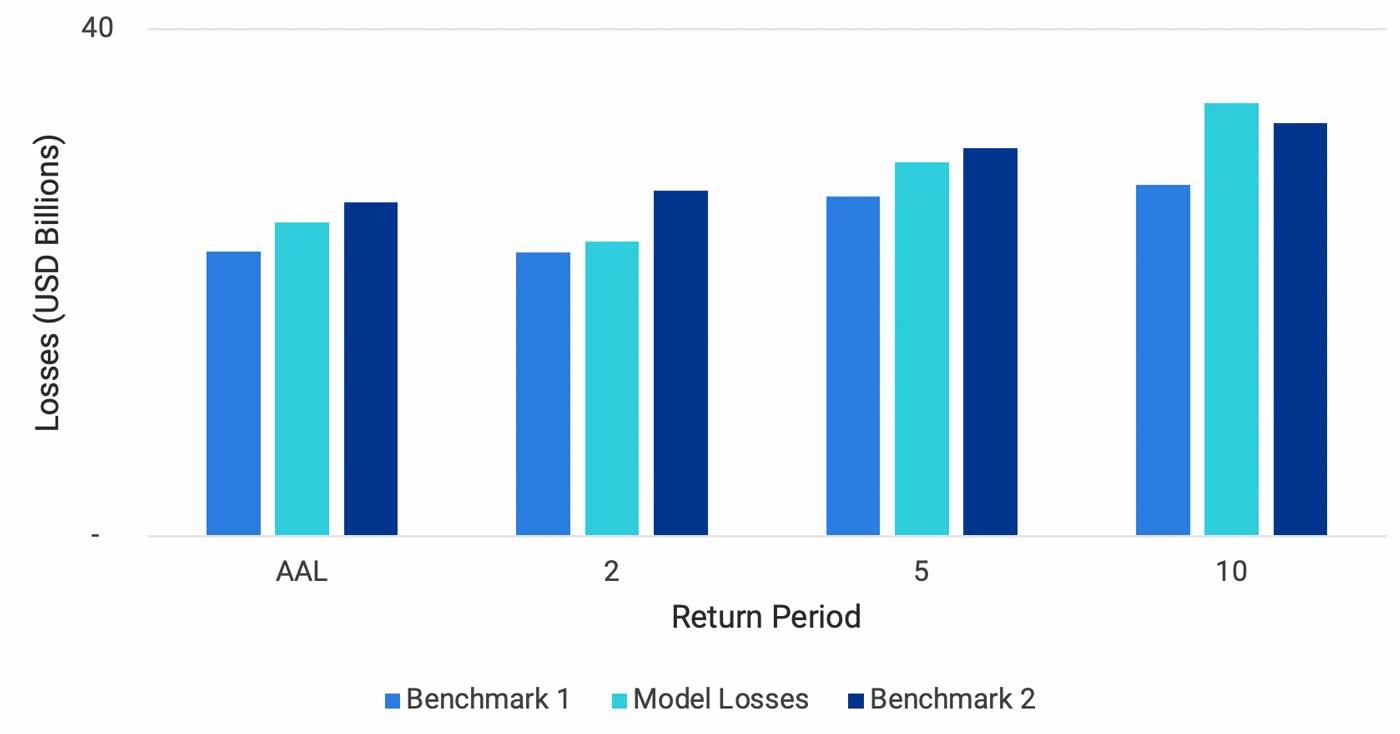
Benchmarks were developed for personal, commercial, and automobile lines of business, as well as for all lines combined, and for all states within the contiguous United States. These benchmarks were used to evaluate the modeled EP curves for the updated model. Figure 12 shows validation for aggregate losses for the contiguous United States for all lines of business and all perils. The modeled losses agree well with the benchmarks across all return periods. The exercise is repeated across the individual states for specific lines. While the details provided here evaluate the aggregate view of risk, it should also be mentioned that validation is performed on occurrence losses to ensure that the model is able to reasonably capture the characteristics of the most severe events each year.
Verisk’s rigorous validation process, facilitated by the vast amount of data Verisk has access to, allows you to feel comfortable that the model provides a good representation of the severe thunderstorm risk in the United States and is therefore an excellent tool for ratemaking.
Blending Model Results with Historical Claims Data
The volatility in year-to-year severe thunderstorm losses and recently observed outlier experience means that traditional ratemaking approaches are not sufficient for developing actuarially sound prices. The Verisk U.S. severe thunderstorm model provides a reliable and stable view of severe thunderstorm risk and avoids shifts in loss costs caused by the volatility in loss experience data. Historical claims data can be volatile but may not need to be discounted entirely. Clients may want to use and/or regulators may require observed loss values. The ratemaking approaches discussed in the next paragraphs include integrating both, accounting for tail risk and preventing volatility at granular levels of geography.
The frequency of severe thunderstorms may lead some insurance companies to believe that they have sufficient data to manage and price severe thunderstorm risk without the use of probabilistic tools; however, an excess wind factor (or an alternate method using long-term averages alone) is unlikely to capture the tail risk associated with this peril because the method relies only on the company's historical claims data. Most companies are unlikely to have experienced a "normal" amount of extreme low frequency/high severity losses within the time frame of the available data; and historical claims data, particularly long-term, may not reflect a company's current exposure distributions. The Casualty Actuarial Society (CAS) Statement of Principles Regarding Property and Casualty Ratemaking states, “A rate provides for all costs associated with the transfer of risk." Therefore, we explore additional ways to incorporate this risk.
Rating Methods of Blending Modeled and Historical Loss Amounts
Using Verisk’s updated severe thunderstorm model, insurers may rate severe thunderstorm using approaches that include modeled and non-modeled (historical loss data). Examples of such approaches include:
- Combining historical non-wind or catastrophe losses and modeled severe thunderstorm wind and hail losses using the Verisk “all-events” U.S. severe thunderstorm catalog.
- Using non-cat historical wind and hail and historical non-wind, non-cat losses with the Verisk “cat events” severe thunderstorm catalog.
- Blending non-catastrophic historical loss data with company catastrophic historical severe thunderstorm losses limited to a threshold (T). Modeled severe thunderstorm losses can be used above this threshold. The estimated loss cost therefore is made up of three components: attritional (non-catastrophe) losses, catastrophic severe thunderstorm historical losses below a threshold, and modeled severe thunderstorm losses above this threshold.
The actuary must evaluate the extent to which the long-term historical data is representative or reasonably useful for ratemaking. Assuming historical data is reasonably representative, we discuss an example of the #3 approach compared to the traditional approach using historical data exclusively as well as using modeled losses only for the severe thunderstorm loss estimates. Note that the approaches described above as well as the example below omit consideration of the hurricane peril and other catastrophic risk for simplicity.
In this example, actual trended historical non-catastrophic loss experience for the most recent five years, excluding PCS wind losses, is used; we call this term A. Next, a catastrophic wind factor is equal to the ratio of 20-year PCS event non-hurricane wind loss limited to a threshold (T); to attritional loss or non-catastrophic loss. We will call this ratio B. Finally, using Verisk’s updated U.S. severe thunderstorm model, the average annual loss in excess of T can be determined, which we will call C’. The blended loss cost, method 3, can then be calculated as:
Loss =A * (1 + B) + C’
Note that using the total loss amount estimations described in methods 1 and 2 above set B=0 and this simplifies to:
Loss=A + C
Where C=total or uncapped AAL for either the all-events or cat-only events catalog depending on whether methods 1 or 2 are used.
This blending approach properly accounts for the entire distribution of losses, and companies can perform sensitivity analyses by setting and adjusting loss thresholds. Note that the selection of an appropriate threshold can be based on actuarial judgment or techniques such as credibility weighting. Note that credibility could also be used by companies that lack sufficient data at lower exceedance probability levels, with modeled losses serving as the complement of credibility.
Case Study
In this case study we discuss the methods described as used by a hypothetical insurer. For methods 1 and 2 the calculation is straightforward. When using Method 3, the insurer tests the sensitivity of loss costs to different thresholds between loss data and modeled losses when blending model output and historical losses for ratemaking as described. They first determine their annual aggregate exceedance probability curves for modeled loss. Next, the insurer selects losses that correspond to several points on the modeled annual aggregate loss exceedance probability curve as shown in Figure 13, which displays the 20-year PCS event losses for this insurer in the State of Missouri. The choice of this as the threshold is based on judgment and consideration of the variability of the loss data at different thresholds. Note that the trend method underlying this example differs from those described in the “Benchmarking and Validation” section, as in ratemaking we are using trends to forecast data.
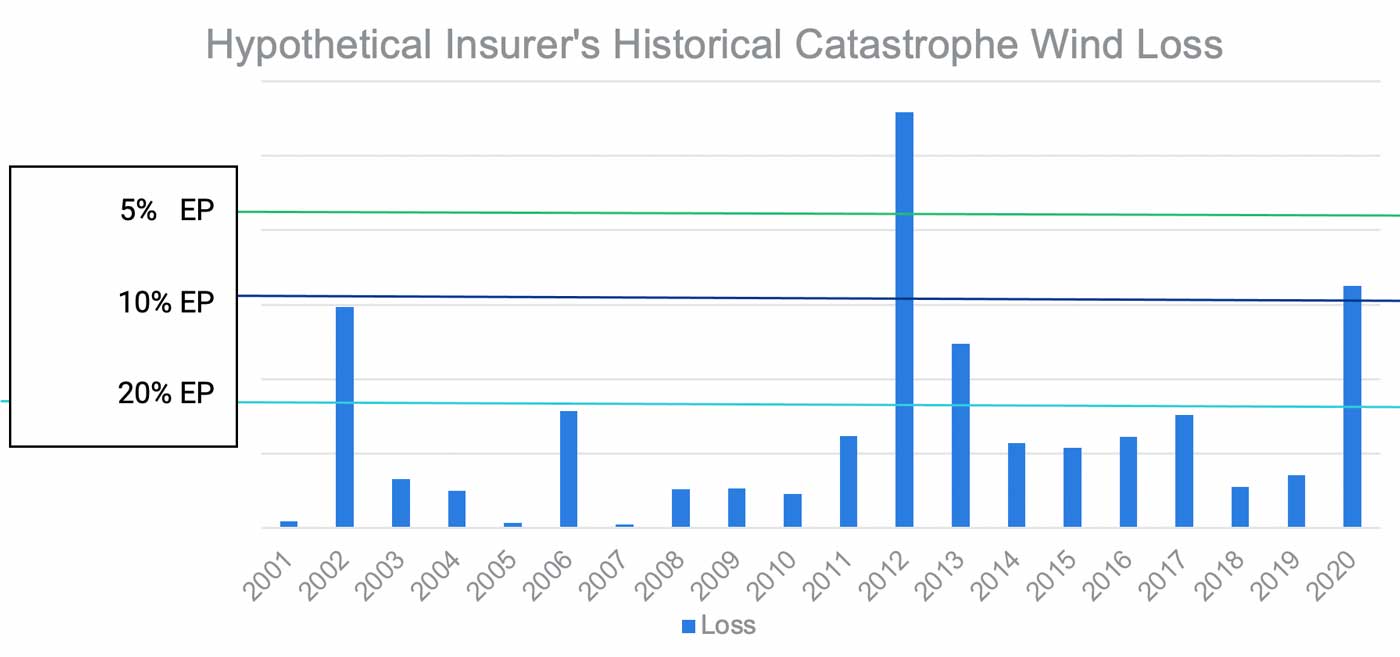
Based on the observed data displayed in Figure 13, the insurer’s actuary selects the 20% EP or 5-year return period as the threshold T. In Figure 13, one can see that the variability in the experience period between years is significantly higher at the 5% EP level. The variability in experience at the 10% EP is also more volatile than that at the 20% level.
The losses to be included in the insurer’s rate filing writing a reasonably distributed percentage of the risk statewide is shown below for methods 2 and 3, as well as the traditional method relying on historical losses exclusively.
The resulting loss cost will be a reasonably stable estimate, which includes the tail of the catastrophic non-hurricane wind losses. Note that if the actuary decides that the long-term PCS losses are based on exposure distributions that are no longer representative or that the experience is too volatile to include, the formula above can be simplified using methods 1 or 2.
The following calculations illustrate the approaches described above:
Hypothetical Rating Examples
- Using the Traditional Method, the formula eliminates C’ and the formula becomes:
- Loss = A * (1 + B); Where:
- A = Statewide 5-Year Average Non-Cat Trended Losses = 65 million
- B = Statewide 20-Year Average Cat Loss/Non-Cat Loss = 35 million / 62.5 million
- Loss = 65 * (1 + 35 / 62.5) = 101.4 million
- Loss = A * (1 + B); Where:
- Losses estimated using Method 2 described above sets B = 0 (effectively, the threshold T is set to 0), and the formula becomes:
- Loss = A + C; Where:
- A = Statewide 5-Year Average Non-Cat Trended Losses = 65 million
- C = Modeled Severe Thunderstorm AAL = 50 million
- Loss = 65 + 50 = 115 million
- Note that method 1 would be calculated similarly with non-cat severe thunderstorm losses removed from A and the C to the all-events severe thunderstorm catalog AAL.
- Loss = A + C; Where:
- Losses estimated using Method 3 described above uses the full blending formula:
- Loss = A * (1 + B) + C’; Where:
- A = Statewide 5-Year Average Non-Cat Trended Losses = 65 million
- B = Statewide 20-Year Average Cat Loss/Non-Cat Loss = 35 million / 62.5 million
- C’ = AAL in Excess of 20% EP
- Loss = 65 * (1 + 30 / 62.5) + 15 = 111.2 million
- Loss = A * (1 + B) + C’; Where:
Managing U.S. Severe Thunderstorm Risk with Verisk’s Best-in-Class Model
According to Verisk’s recent report, “Understanding evolving hail risk,” more than 6.8 million properties were affected by one or more damaging hailstorms in 2021, a nearly 10% increase from the 6.2 million properties affected in 2020. Managing the risk from low frequency, high impact events such as severe thunderstorms should be a part of every insurer's risk management strategy.
When using a catastrophe model to inform pricing, it’s essential to realistically and comprehensively reflect the nature of the peril being priced for. The state-of-the-art component-level hail, straight-line wind, and tornado damage frameworks, coupled with significant volumes of claims data as well as radar and storm report data—detrended both to remove population and reporting biases and to address trends that may exist from climate change—ensures that the Verisk Severe Thunderstorm Model for the United States provides you with a near-present view of U.S. severe thunderstorm risk. It is just as important to ensure that the model captures realistic footprints from the most severe events, especially when using a blended loss data approach to pricing as described in the previous section. The high-resolution footprints within the Verisk model ensure that damage can be realistically concentrated, and the potential for extreme levels of damage is accurately represented when those footprints overlap with areas of dense exposure concentration.
The Verisk Severe Thunderstorm Model for the United States can help you minimize accumulations of risk, strategically price your policies, and determine effective reinsurance and risk transfer strategies. In ratemaking, using model output in conjunction with historical loss data allows you to develop sound pricing that properly reflects the entire range of potential severe thunderstorm loss experience—especially the tail risk, which is often missed by looking solely at claims data—while satisfying the insurer’s or regulator’s desire for the use of historical claims data.
