


Uncertainty in Estimating Commercial Losses—and Best Practices for Reducing It
Jul 28, 2011
Editor's Note: AIR Principal Engineer Dr. Vineet Jain explains why commercial losses are more unpredictable than residential losses and provides some best practices to follow when modeling commercial portfolios.
Yearly insured losses to commercial properties from natural hazards are on the same order of magnitude as insured losses to residential properties. However, accurately estimating potential commercial losses is especially challenging. Commercial properties include a wide range of very different structures; the business interactions that contribute to commercial loss are often intricate, complex, and contingent; and the insurance terms and practices that are applied to commercial holdings are both different and much more complicated than those applied to residential properties. These conditions make for greater uncertainty in the effort to estimate potential commercial losses. But there are a variety of best practices that can be employed by users of catastrophe models that will both help to identify the sources of uncertainty and to reduce it.
Sources of Uncertainty in Estimating Commercial Losses
The factors identified above that drive uncertainty in commercial loss estimates are explained in greater detail here.
Commercial Structures Are Diverse and Their Responses Complex
Most residential buildings are—to oversimplify—four-walled boxes of one or two stories. As Figure 1 illustrates, commercial structures are considerably more varied; they include airport hangars, churches, gas stations, golf courses, hospitals, hotels, industrial facilities, marine hulls, offices, offshore drilling platforms, skyscrapers, sports stadiums, strip malls, warehouses and wind turbines. The very shape and configuration of these structures have significant implications for their vulnerability. Further, there can be very different types of structures within a commercial occupancy class. For example, "church" may refer to a small single story building of simple configuration or to a large cathedral—variety that adds uncertainty in the estimation of losses based on a broader class of occupancy.

Again unlike their residential counterparts, commercial construction classes are also highly variable, and range from vulnerable light-metal buildings to well-engineered reinforced concrete structures. Yet the correct identification of commercial construction classes from a visual inspection alone is not a trivial task. It is therefore not uncommon that property owners and underwriters miscategorize these structures. Additionally, there can be differences in construction practices that affect vulnerability even when it is properly categorized. Such errors and uncertainties can produce distortions in model output.
Most damage to mid- and high-rise commercial structures comes from their non-structural components such as windows, roofs, and other architectural features. The tolerances of these features under wind and earthquake loads are not as well understood as the responses of structural elements, and they therefore introduce greater uncertainty when modeled. Similarly, damage to well-engineered commercial structures often can be a function of circumstances. The kind and severity of the damage a high-rise office building suffers during a hurricane, for example, may be totally contingent upon whether nearby buildings use gravel ballast as a roof-covering and which way the wind blows.
Finally, only limited damage information is available at present on the behavior of a wide range of open frame structures (such as are common in large industrial facilities) and structures like cooling towers—and the configuration of some newer technologies like solar panel and wind turbine arrays and their support equipment and buildings. Structures that radically depart from rigid box-like buildings can be dynamically sensitive to even small disturbances that amplify their otherwise innocuous natural responses, such as vibration, during extreme events, thereby possibly leading to significant damage or even the failure of an entire structure.
Recognizing this diversity, AIR has greatly expanded the number of detailed commercial and industrial occupancies supported in the models in recent years in order to better estimate vulnerability at a more granular level.

By: Dr. Vineet Jain
Edited by Robert Zalisk
Commercial Contents Vary Considerably
"Contents" in the context of catastrophe modeling generally refers to moveable assets located inside a building. While the contents of residential properties remain much the same over time and largely similar from one property to another in terms of the ratio of contents replacement value to building replacement value, for commercial properties the relationship is often much more complex. The ratio of contents value to building value, for example, can be significantly different for different occupancies. Commercial contents may range from office furniture and equipment, to perishable food items in a supermarket, sensitive medical equipment in a hospital, or artwork in a gallery. Additionally, the ratio of contents to building can fluctuate significantly over time even for the same commercial structure: as a warehouse's inventory builds up and is then shipped out, for example, its contents can be different every day of the week. To use simplistic rules of thumb to calculate the value of contents based on building value can result in serious errors in loss estimation.
Business Interruption Is Complex
The loss of business income as a result of a catastrophe can also vary considerably. Business income is derived from providing services or manufacturing a product. In either case, income may or may not be dependent on location. For example, an office-based service business that is damaged by a catastrophic event can temporarily set up operations elsewhere relatively easily compared to a manufacturing business that requires the specialized equipment in its damaged factory. Additionally, many commercial policies cover multiple locations, and even the insured may not know how its assets and business income are distributed across the different holdings. Crude approximations can lead to large errors.
Similarly, a business may or may not have a business continuity plan that effectively meets the exigencies of a particular disaster; if it did, that could help reduce its loss of income because of downtime. Another business might not even suffer damage—but have its supply chains or lifelines (public services and utilities) severed, and so it still would lose income. Also, business interruption losses can have long tails: there were many open claims years after the 9/11 terrorist attacks and Hurricane Katrina.
Appropriately valuing property and business income is very challenging. A catastrophe model must provide for a wide range of contingencies and for variations within those uncertainties. But the model user, to obtain the most accurate results, must also perform due diligence in obtaining the best possible information. The common "square footage" method of valuation for properties is not effective for all kinds of commercial structures. And business income exposure is even less apparent and tends to be underestimated.
Commercial Policy Structure Adds to Loss Uncertainty
Commercial risks are usually insured by multiple insurance carriers. Coverage of a $250 million commercial property, for example, might be shared by multiple insurance companies, each covering a different layer of loss. This feature of commercial practice itself produces uncertainty. While the modeled ground-up losses for a commercial property can be quite close to the actual loss that asset will suffer from a catastrophe event, the modeled loss for each individual company (once the terms of the different layers are applied) can appear to be very different from their actual loss.
That is because the amount of losses in any particular loss layer is highly uncertain. The damage distribution curve for each layer will generally have "fat tails" on both sides of the mean loss—which is to say that the probable loss within the layer would follow a hit or miss typology: the layer would be most likely to suffer either significant loss or no loss.
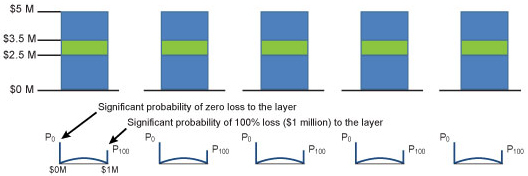
Consider, for example, this idealized scenario: a company has insured $1 million of a property valued at $5 million for losses in excess of $2.5 million. This $1 million layer of insurance has a high probability of both no loss and 100% loss. Why? For every scenario in which losses are less than $2.5 million, there is a zero loss to the layer and therefore the probability of no loss accumulates. Similarly, for every scenario where losses are above $3.5 million, losses to the layer are $1 million, so there is a high accumulated probability of 100% loss to the layer.
Again, these dual accumulated probabilities increase the loss uncertainty for this layer by shifting the probability weights toward the extremes: the insured layer has a high probability of both no loss and 100% loss. However, the estimated mean loss for the layer in our example is 5%—or $50,000.
Consider further that the company has an account consisting of five such holdings—five risks, each amounting to $1 million. Thus, the account's net exposure is $5 million, while its total expected loss will be $250,000 (5% [the mean loss per layer] × $1 million × 5 properties = $250,000).
This account is illustrated in Figure 2. The five blue bars represent the five properties valued at $5 million each, and the green segment represents the layer of $1 million covered by our example company. A representative damage distribution curve for the insured layer is shown beneath each property. Note the large spikes (tails) of probability at both 0% and 100% loss.
Compare this account to another that also consists of five risks, each also worth $1 million. In this scenario, however, each risk—which represents an entire property, not just a layer of potential loss—is covered to its full value of $1 million (a scenario typical of residential coverage). The net exposure to the company in this case is also $5 million. Similarly, to make the example directly comparable, the estimated mean loss to each risk (that is, to each property) is again 5%, as in the previous scenario.
This account is illustrated below in Figure 3, where the five green bars represent the five properties valued at $1 million each (and are insured for the same). A representative damage distribution curve is shown below each property (risk).
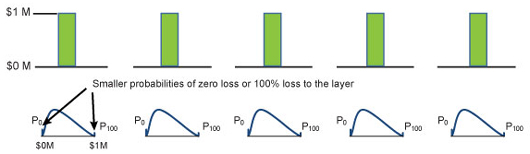
For this kind of (non-layer) risk, however, the uncertainty with respect to losses is likely to be less—as indicated above by the configuration of the representative damage distribution curves, which are not as heavy-tailed as in the previous case; that is, the spikes at 0% and 100% loss are considerably smaller.
Which account, then, has a better chance of having its modeled mean losses match the actual losses (which is one realized outcome of the uncertain loss phenomenon) a catastrophe event will produce? The risk to the first account is comparatively much more uncertain, and that greater uncertainty can amplify minor inaccuracies or introduce distortions in the estimated losses. Thus, simply as a result of the configuration of insurance terms, a catastrophe model has a better chance of reproducing mean losses that more closely match the actual losses experienced by the second account.
To illustrate, say the actual losses to one of the properties in the first account came to $3.5 million—while the model-estimated losses had been $3 million. Thus, the modeled ground-up losses were about 15% less than actual losses. However, the modeled gross loss—the modeled losses to the layer, which in this case came to $0.5 million—was 50% less than actual losses to the layer, which, again, amounted to $1 million.
This propensity for small misestimates in ground-up losses to become amplified in the gross loss estimates highlights the importance of considering both ground-up and gross losses when validating a model. Also, of course, it is important that the damage probability distribution a model employs be sound, since an accurate estimate of mean losses in an insured layer depends on how well the tails are captured.
Fewer Risks Means Higher Uncertainty
Finally, in addition to the sources of uncertainty discussed above, commercial portfolios generally have fewer risks than portfolios of residential properties. For portfolios with large numbers of risks, any uncertainties in model loss estimation tend to cancel out each other (e.g., any overestimation in hazard at one location compensates for any underestimation in another location), leading to a reduction in overall portfolio uncertainty per unit of exposure. That is, the catastrophe model benefits less from the law of large numbers, adding yet another level of uncertainty.
Reducing Uncertainty: Best Practices for Modeling Commercial Portfolios
While the modeled losses to commercial portfolios are characterized by higher uncertainty than residential losses for the reasons discussed above, the model user can reduce the uncertainty by routinely following a number of best practices.
- Familiarize yourself with your model's performance by undertaking this exercise with selected portfolios: Compare the model's losses for several different historical events to your actual losses for those events. This is a good starting point for understanding your exposure and how the model processes your portfolios. For example, your portfolio may cover contingent business interruption (CBI) for most policies, while the model assumes more typical policy conditions where CBI is very limited (and thus your BI losses may be underestimated).
- Enter accurate policy information for all covered perils. This should be done policy by policy rather than by bulk coding. As observed from recent hurricane loss data, for example, losses from storm surge can exceed losses from wind, so correctly coding storm surge coverage is essential.
- Sample selected properties to check that construction types are coded properly. Light metal structures, for example, can easily be mistaken for structural steel, which has a much lower vulnerability. A small sampling of properties could reveal the quality of the coding. For policies covering complex, high-value properties, consider engaging engineering expertise to conduct site-specific analyses. This is a service AIR's CRE (Catastrophe Risk Engineering) division provides.
- Note that commercial building-based assets and non-building-based assets can have very different vulnerabilities; they need to be properly identified. For example, the assets of small industrial facilities generally are housed inside, while those of large facilities are kept outside or in non-typical structures. If both types of facilities are coded the same, estimated losses will be distorted.
- Include secondary risk features when identifying (coding) commercial properties. Key secondary features such as the extent to which glass is used, the kind of wall cladding employed, and roof type can significantly alter the risk profile of a commercial portfolio. For example, in the AIR U.S. Hurricane Model, a hotel whose cladding is 75% glass is considered to be 20% more vulnerable than a hotel whose cladding is only 5% glass.
- Check the accuracy of your property and business income valuations. Benchmark the exposure values in your portfolios against industry standards. Do your portfolio values agree with claims from actual earlier disasters? Use business income sheets to determine business income for each location wherever possible. Robust loss estimates require accurate and appropriate data.
- Aggregated commercial exposure data must be properly disaggregated and geocoded before analysis is performed. For example, exposures should not remain geocoded at the centroid of a CRESTA area. Losses from flood or storm surge are particularly sensitive to location; even a "perfect" model will produce unreliable results if property location is inaccurately entered.
- For high-value, non-diversified portfolios, be sure to include the effects of correlation in modeled loss estimates. Modeled losses for a geographically-concentrated portfolio consisting of a relatively few high-value properties (such as a wind farm whose ten turbines have been built by the same manufacturer) are more uncertain because of correlation. It is important that the model user identify such portfolios in the software. In CLASIC/2, for example, uses should take advantage of certain options that explicitly address correlation. This practice becomes even more important when using models for pricing an individual account.
- Be aware of portfolios whose net exposure is only a small percent of the total value of the properties. These exposures can be very sensitive to policy conditions, as described earlier. It is very important that policy conditions are properly captured in the model. Extra attention should be paid when converting exposure data from one format to another.
- Undoubtedly, some risk will remain that is not covered in the model. Companies should work closely with their model vendor to understand what is modeled and what is not modeled. Similarly, they should let the model vendor know what is covered and not covered under the terms of insurance.
Conclusion
While commercial holdings can be complex in their diversity and complicated in their interactions, a significant degree of the uncertainty in commercial losses can be reduced by ensuring high quality model inputs and by having a good understanding of a model's limitations when applied to a specific portfolio. Working actively and openly with your model vendor can facilitate this effort. Uncertainty will never be eliminated, but it can be reduced and managed—and it need not result in unpleasant surprises.
