


Managing Inland Hurricane Wind Risk: Thinking Beyond the Coast
Jun 22, 2020
Editor's Note: This article is an update of an article originally published in May 2011 by Dr. Ioana Dima and Dr. Tim Doggett, discussing past inland hurricanes and their impacts, reviewing the basis for considering hurricane wind risk in inland states, the challenges in modeling this risk, and how to manage it with the updated AIR Hurricane Model for the United States, anticipated for release this summer.
According to the 2016 U.S. census, more than 50 million people live in a county on the coast of the Atlantic Ocean or the Gulf of Mexico, and coastal communities anxiously await their fates each hurricane season. Because damaging winds are less likely far inland, the hurricane risk to the interior of the U.S. can be overlooked; however, we know that storms can travel hundreds of miles after landfall and the remnants of hurricanes may occasionally reintensify. Storms may also merge with pre-existing mid-latitude fronts, developing into powerful extratropical cyclones. Furthermore, the exposed inland properties tend to be more vulnerable compared to coastal construction, which is subject to stricter building codes, and inland communities are far less prepared for hurricanes.
Hurricanes not only penetrate inland counties but can continue into noncoastal states. Landlocked states that have historically been affected by damaging winds associated with U.S. landfalling hurricanes are shown in the lighter blue in Figure 1.
A Look at Past Inland Storms
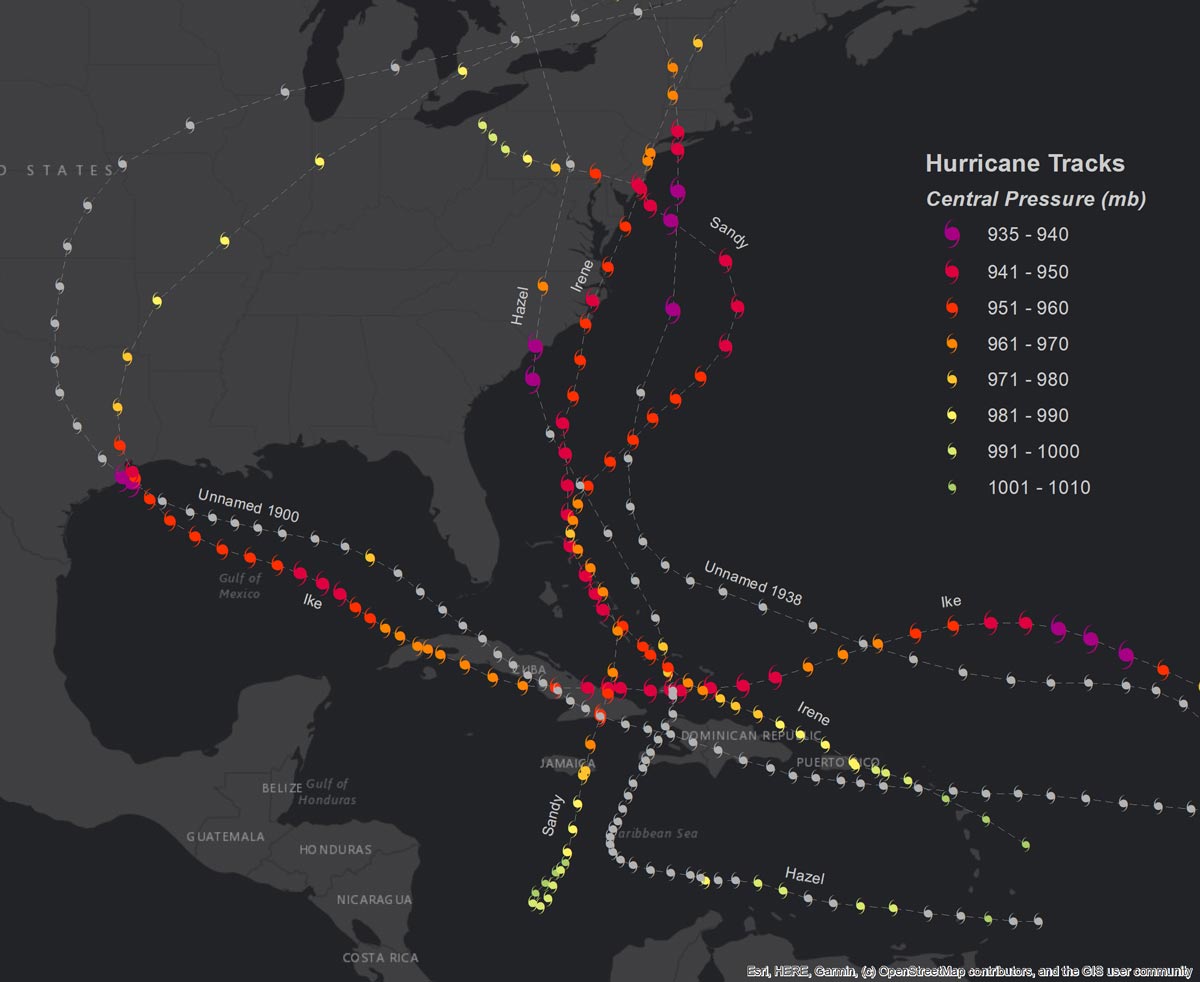
History has repeatedly demonstrated that hurricanes can penetrate deep into the interior of the United States, causing significant losses not just to noncoastal counties, but to noncoastal states. The 1900 Galveston, Texas, hurricane traveled deep into the U.S. interior after landfall. The storm maintained tropical cyclone status as it moved into the Upper Midwest, bringing damaging winds to more than half a dozen states, including Illinois, Indiana, and even Vermont. Were a similar event to occur with present-day exposure, AIR estimates that insured losses to onshore properties would exceed USD 50 billion, with more than USD 1.5 billion of loss in inland states.
In 1938, the Great New England Hurricane was the first major hurricane to affect the Northeast in almost 70 years. The storm’s fast forward speed allowed it to maintain much of its strength over the cool northern latitude waters before making landfall in Long Island, New York, at Category 3 strength. From there, it barreled north, destroying more than 50,000 homes in eight states, before transitioning into an extratropical system as it moved into Canada. Today, a recurrence of a storm like the Great New England Hurricane would cause more than half a billion dollars of insured loss in noncoastal states.
In 1954, Hurricane Hazel made landfall as a Category 4 hurricane near the North Carolina/South Carolina border, transitioning into an extratropical system over the following several hours. The storm nevertheless retained its damaging wind speeds over the Mid-Atlantic states and into central Pennsylvania and western New York, where peak gusts of 90 mph were recorded. A recurrence today of a storm like Hurricane Hazel would cause more than USD 20 billion of insured loss, including more than USD 2 billion in the inland state of Pennsylvania alone.
More recently in 2008, Hurricane Ike made landfall at Category 2 strength near Galveston, Texas. On the following day, Ike had dissipated into a tropical depression some 170 miles from its landfall location. While Ike dissipated at a rate fairly typical for a Category 2 hurricane, the sheer size of the storm led to greater inland penetration than might be expected of a more compact system. Ike's remnant energy continued moving north, where it combined with a pre-existing extratropical system moving through the Midwest. This new complex storm system produced heavy rainfall and high winds in 10 states in the Midwest and the Northeast. Final damage estimates issued by ISO®’s Property Claims Services (PCS) totaled USD 12.5 billion, more than USD 2.5 billion of which occurred in seven inland states.
In 2011, Hurricane Irene made several U.S. landfalls as it hugged the East Coast, the final one at tropical storm strength in Brooklyn, New York. It maintained much of its strength as it tracked through New England, causing widespread power outages and flooding. Notably, the torrential rainfall caused some of the worst flooding in Vermont’s history, with many towns completely cut off and thousands of roads and bridges damaged. Total damage from Irene in Vermont alone was estimated at more than USD 700 million.
Hurricane Sandy in 2012 made landfall in southern New Jersey before merging with a cold front and transitioning into an extratropical storm. Sandy will long be remembered for the impacts of its storm surge in New York and New Jersey, but it also caused damaging winds over much of the northeastern U.S. and into Canada. Insured losses were reported in the inland states of Vermont, Pennsylvania, West Virginia, and Ohio, totaling more than USD 1 billion, according to PCS®.
Modeling Inland Hurricane Wind Risk
Hurricanes weaken when they interact with the terrain and lose their energy source—warm ocean waters. Nonetheless, storms can retain enough strength to produce damaging winds well inland. According to the historical catalog for the AIR Hurricane Model for the United States (which reflects an hourly interpolation of NOAA’s HURDAT database), the average time it takes for a landfalling hurricane to dissipate is about 34 hours. Considering a range in forward speeds of 10 to 20 mph (the average is ~14 mph), this translates to an overland distance of 340 to 480 miles, a considerable distance from the coast.
There are several factors that AIR takes into account to model the extent of inland hurricane wind risk. These include the intensity of the storm at landfall, the forward speed of the storm, the size of the wind field, and the storm’s rate of decay (or filling). In general, stronger storms (although they fill at a faster rate) will maintain damaging winds for a longer time than weaker storms, increasing the impact further inland. Likewise, faster moving storms will travel greater distances inland, while larger storms will impact a greater total area.
A storm’s filling as it moves over land has been a longstanding subject of research, motivated by the need to forecast damaging winds not just at the coast, but also far inland. Ho et al. (1987) conducted a thorough analysis of the data available at the time to calculate average filling rates for different regions along the U.S. coastline. His work was published in NOAA Technical Report, NWS 38, “Hurricane climatology for the Atlantic and Gulf coasts of the United States.”
Kaplan and DeMaria (1995) developed a statistical model for predicting the decay of tropical cyclone winds as a function of the landfall intensity and time elapsed since landfall. This inland wind model can be used to create maps of the maximum possible sustained inland wind speeds for different coastal regions. As an example, Figure 3 shows significant potential inland penetration from fast moving storms making landfall on the Gulf Coast.
Vickery (2005) proposed a model that predicts the increase in central pressure, also based on storm intensity, forward speed, and time elapsed since landfall. In addition, for storms affecting the Gulf Coast or the Florida Peninsula, Vickery found an inverse relationship between the radius of maximum winds and the rate of decay.
 Sylvie Lorsolo, Ph.D.
Senior Scientist and Senior Manager
 Eric Uhlhorn, Ph.D.
Principal Scientist
Edited by Nan Ma, CEEM
These statistical filling models were developed using a similar basic principle of fitting filling rates to the evolution of storm intensity (be it wind speed or central pressure) after landfall. They have been rigorously peer-reviewed and are well validated using actual storm data since their development. AIR’s storm decay model is based on a reanalysis of the data used for developing the three models, as well as additional observational data and the latest published research.
The AIR U.S. hurricane model also accounts for the fact that storms that reach higher latitudes tend to have faster forward speeds, including observations of more than 60 mph in the northeastern U.S. Fast storms result in higher losses farther inland, although they subject buildings to damaging winds for a shorter duration. The model also allows storms to reintensify post-landfall, which happens in approximately 5% to 10% of storms after extratropical transition and is typically observed 12 to 16 hours after landfall in the mid-latitude regions.
Realistic modeling of surface-level wind fields requires properly accounting for the effects of the local environment on wind speeds. Along the coast of southern Florida, for example, where swampy surfaces, rough urban surfaces, and ocean surfaces are often located alongside each other, wind speeds can vary quite dramatically as a result of surface friction. Knowing the location and intensity of the strongest surface-level winds in a hurricane is critical to producing reliable loss estimates. By incorporating the latest satellite- derived, high-resolution, land use/land cover (LULC) data, the AIR model captures the accumulated surface friction effects of land and water based on the direction of the wind at each location.
Managing Inland Hurricane Wind Risk
While not a primary driver of insured loss, wind risk from hurricanes in inland regions is far from negligible. Historical experience, bolstered by recorded data in more recent years, has repeatedly demonstrated the presence of damaging winds far inland from a hurricane’s original landfall location. Losses to inland states alone could reach USD 1 billion or more from a single storm.
The updated AIR Hurricane Model for the United States reflects a thorough understanding of the factors that make some storms dissipate quickly upon reaching land, and other factors that allow storms to maintain tropical cyclone strength well into the interior of the United States. Fully understanding inland risk also requires consideration of regional variations in the vulnerability of structures to the observed winds. AIR’s damage functions reflect a detailed understanding of the evolution of building vulnerability in the United States, including the fact that inland properties are relatively more vulnerable than coastal ones because when it comes to wind and hurricane risk, code enforcement is generally more stringent in coastal counties, as they have a higher risk. For better differentiation of vulnerability across regions and time periods, the model incorporates information on the adoption and enforcement of building codes throughout the country, changes in building materials and construction practices, and structural aging and mitigation features, as well as the specific year of construction. The model has been validated with a significant amount of claims data from storms occurring during the past 25 years.
With each hurricane season, resilient risk management requires communities, local governments and building officials, emergency planners, and insurers to think beyond the immediate coast.
References
Ho, F. P., J. C. Su, K. L. Hanevich, R. J. Smith, and F. P. Richards, 1987: Hurricane climatology for the Atlantic and Gulf coasts of the United States. NOAA Technical Report, NWS 38, 193 pp.
Kaplan, J., and M. DeMaria, 1995: A simple empirical model for predicting the decay of tropical cyclone winds after landfall. J. Appl. Meteor., 34, 2499-2512.
Vickery, P. J., 2005: Simple empirical models for estimating the increase in the central pressure of tropical cyclones after landfall along the coastline of the United States. J. Appl. Meteor., 44, 1807–1826.
