


Volcano!
Assessing Non-Modeled Risk Using the Geospatial Analytics Module in Touchstone®
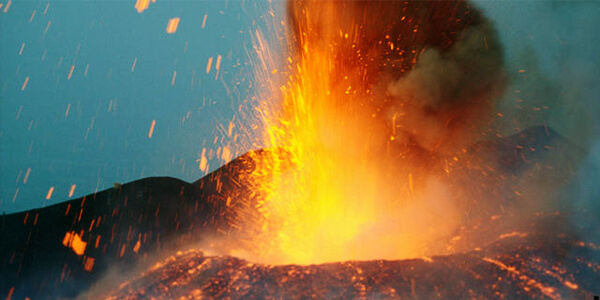
In 79 AD, one of history's most infamous volcanic eruptions buried tens of thousands of people in hot ash and molten rock. Over the course of two days, Mt. Vesuvius blasted volcanic gas, ash, and fumes more than 32 km (20 miles) into the atmosphere; the initial explosion destroyed the towns of Pompeii and Herculaneum almost instantaneously.
Nearly 2,000 years later, almost four million people live in and around Naples, Italy near this active volcano. As many as 600,000 people live in the so-called Red Zone at the volcano's base.
Many geologists and volcanologists believe that Vesuvius is overdue for an eruption and that, when it happens, it is likely to be explosive. How high would losses be? Although we know that, like any other natural disaster, no historical eruption will happen exactly the same way again, an analysis of the historical event can help us quantify the materiality of this non-modeled risk.
Find out more about Touchstone here
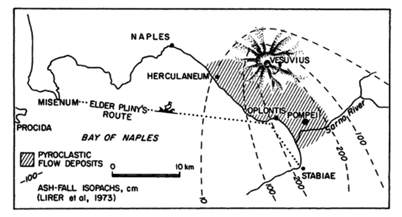
Such an analysis is enabled by using published studies on the historical eruption, in this example, one by volcanologist Haraldur Sigurdsson et al. By importing a shapefile created by geo-referencing Sigurdsson's pyroclastic flow and ashfall footprints into Touchstone and overlaying it on AIR's Industry Exposure Database (IED) for Italy, AIR estimates that total property replacement value at risk is more than EUR 74 billion (USD 100 billion). Of that, roughly 20% would be exposed to pyroclastic flow, a deadly and fast-moving current of hot gas and rock that destroys everything in its wake.
At right: Sigurdsson et al.'s footprint of ashfall depth and extent of pyroclastic flows from the 79 AD eruption
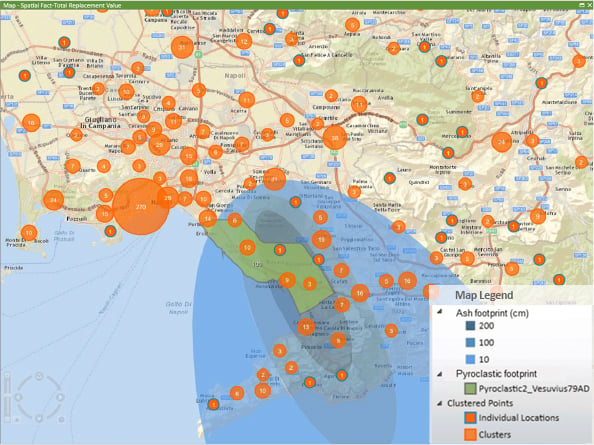
Companies can perform analyses in Touchstone's Geospatial Analytics Module to see how much of their own portfolios would be affected. Most personal and commercial policies in Europe provide coverage for property loss caused by volcanic eruption when it is the result of a volcanic blast, airborne shock waves, ash, dust, or lava flow. Fire or explosion resulting from volcanic eruption also is covered.
At left: Ashfall depth (blue layers) and pyroclastic flows (green layer) footprint in Touchstone with risk counts (in orange) for a hypothetical company portfolio. The city of Naples (the largest circle, middle left) has the highest concentration of risk but escapes most of the damage.
After importing the shapefile, Touchstone users can analyze not only replacement values within the affected footprint, but the potential losses.
Damage ratio assumptions can be assigned to different intensity bands within the footprint, and—because Touchstone's geospatial capabilities are fully integrated with its financial module—policy terms can be applied to calculate exposed limits.
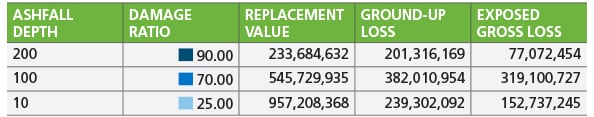
User-specified damage ratios for each intensity band are applied to calculate ground-up loss and gross exposed limits for a hypothetical company portfolio
Not worried about Vesuvius? It's just one of the many dangerous active volcanoes around the world. Companies can use Touchstone's powerful and intuitive features to assess the risk from a wide range of non-modeled perils.
