
A multi-peril crop insurance (MPCI) catastrophe model, like any catastrophe modeling framework, depends on different types of historical data to various extents. Observations from the past are sometimes required for model parameterization, or they may be used for model validation. As uncertainties associated with relevant data sets always pose problems to model developers, the availability of reliable crop data is key to building an MPCI model.
Data Uncertainties
One of the main challenges in developing an MPCI model for Indian agriculture is the scarcity of data regarding harvest area, exposure, crop yield, losses, or indeed any variable of interest. Frequent changes in the national crop insurance schemes further exacerbate the situation.
The program that currently accounts for more than 80% of total sum insured for agricultural insurance—Pradhan Mantri Fasal Bima Yojanaand—has only been operative since 2016. As a result, loss history under PMFBY is too short to estimate a long-term mean of losses representative of underlying risks.
Although validating a model always becomes more difficult in the absence of actual loss statistics, the absence of historical loss data is not the biggest obstacle that a crop risk modeler would face in India. Calculation of losses is relatively straightforward under PMFBY program guidelines and strongly correlated with crop yield. A comprehensive data set for yield information for multiple crops is therefore the most fundamental requirement to assess the crop insurance risk in India.
PMFBY implements an area-based approach where all farmers within a defined “unit” area are insured against an identical crop-specific threshold yield. The most common unit of insurance under PMFBY is “village.” The crop yield data set at village or equivalent units, which is provided by the government to (re)insurers, starts from not earlier than 2005. The length of this data set does not allow crop underwriters to account for significant loss events experienced by farmers prior to 2005, such as the droughts in 1987 and 2002, which resulted in catastrophic crop damage across India.
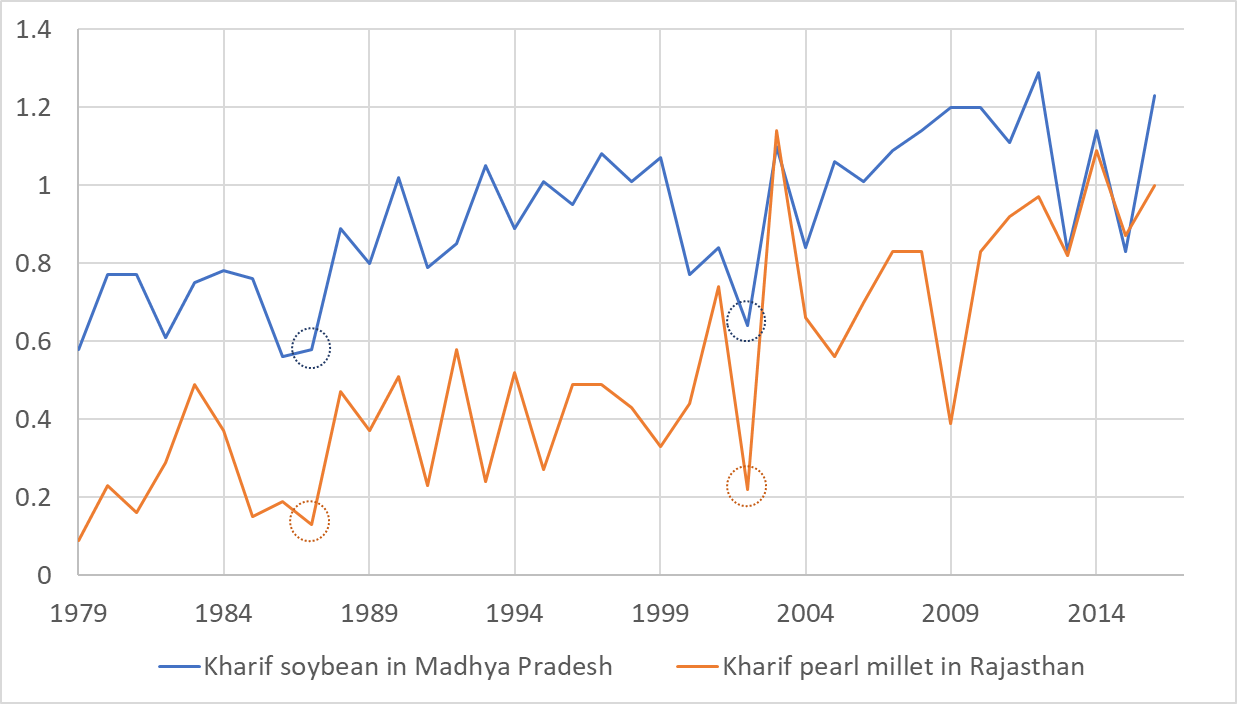
A quick look into state yields illustrates the severe loss experienced by farmers in the 1987 and 2002 Kharif seasons (during the southwest monsoon, May to October), with many of those considered the worst recorded (Figure 1). It is therefore important to include such catastrophic scenarios in a loss modeling framework to account for the probability of losses of similar magnitude occurring again.
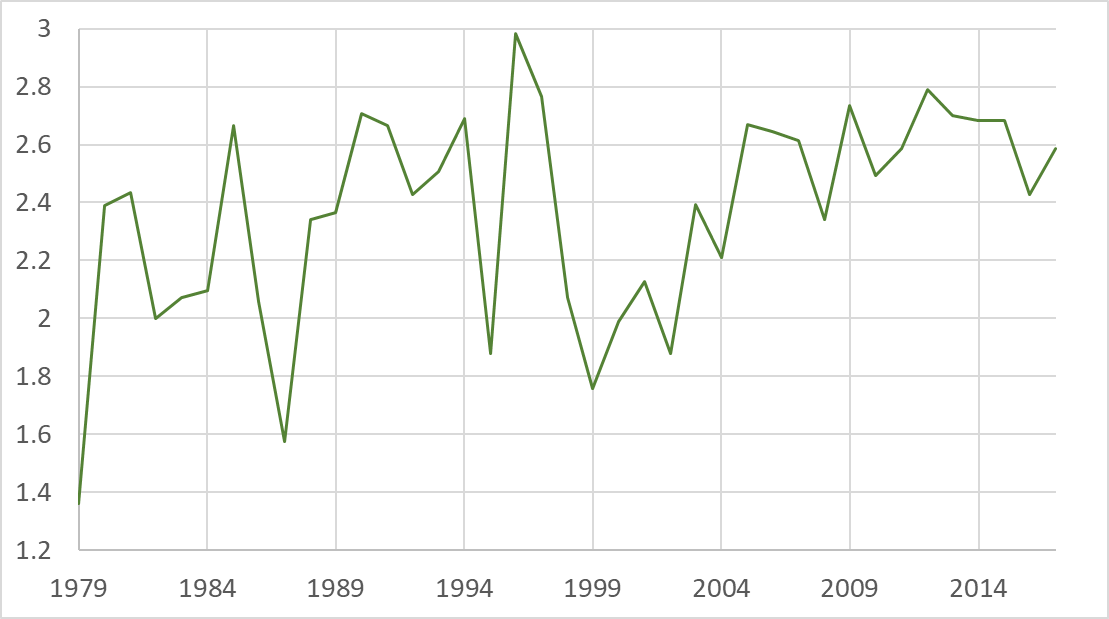
Failure to consider the extreme years is not the only caveat of using a shorter yield record, which often conceals the actual risk associated with yearly variation in productivity of a specific crop at a specific location. For example, rice yield in the Jind district in Haryana has been relatively stable in recent years, compared to noticeably higher inter-annual variability during previous decades (Figure 2). In this case, relying on the yield record for only the last 10 to 12 years would lead to an underestimation of risk. Conversely, it would cause an overestimation in cases where crop yield has been more volatile in recent years. A longer yield record should almost always significantly increase the likelihood of achieving a more accurate and robust view of the risk associated with yield losses within an MPCI modeling framework.
A Unique Yield Database
In India, yield information covering a longer time span is usually available at district level (analogous to county level in the U.S.). The crop area and production information available from the National Informatics Center (NIC), which is the most extensive data set in terms of the number of crops and districts, runs from 1997. The crop database developed under the Village Dynamics in South Asia (VDSA) project by the International Crops Research Institute for the Semi-Arid Tropics also provides district-level yield information from 1966 to 2011 for 19 states.
While these two data sets include hundreds of crop-district combinations, they may be considered inadequate for rigorous risk assessments because they contain numerous gaps and inconsistencies. Researchers at AIR, following diligent and thorough analytical processes, combined the NIC and the VDSA data sets along with other district-level crop yield data available from multiple sources for different states, and generated the most comprehensive district-level crop yield database for India.
Each of the constituent data sets was carefully verified to correct or remove dubious crop area and production information originating from unrealistic reported values (identical numbers across districts or consecutive years), geographic evolution of administrative boundaries over time (593 districts in 2001; 640 in 2011; and 722 as of April 2019), discrepancies in crop names or seasons, and other possible sources of error.
This achievement by AIR’s crop modeling team successfully addresses one of the major challenges associated with developing our Multiple-Peril Crop Insurance Model (MPCI) for India. We anticipate releasing this new model later in the year.
References:
Kumar, M. N., Murthy, C. S., Sai, M. S., & Roy, P. S. (2012). Spatiotemporal analysis of meteorological drought variability in the Indian region using standardized precipitation index. Meteorological Applications, 19(2), 256-264.
Kalsi, S. R., Jenamani, R. K., & Hatwar, H. R. (2006). Meteorological features associated with Indian drought in 2002. Mausam, 57(3), 459.
The World Bank, India: Climate Change Impacts