


 At landfall near Mexico Beach in the Florida Panhandle, Hurricane Michael’s maximum sustained winds were estimated by the National Hurricane Center to be 155 mph, which put it just shy of a Category 5 hurricane. Converting this to a 3-second gust wind speeds over open terrain at 10-meter height gives values between 160 and 175 mph. That's well above the 1700-year design level gust wind speed for this region based on the latest Florida Building Code. A significant portion of the Panhandle's coast would have experienced wind speeds above that design level. While the fate of the communities exposed to this monster storm will become apparent, here is what we can expect in terms of building stock performance in this part of Florida.
After Hurricane Andrew made landfall in 1992, Florida became one of the pioneers of wind design in the United States and the adoption and enforcement of building codes. Since the adoption of the first edition of the Florida building code (FBC) in 2002, Florida has updated the statewide building code every three years.
Prior to FBC, two building codes were in effect in Florida: the South Florida Building Code (SFBC), which was in effect in Miami-Dade and Broward counties and the Standard Building Code (SBC) which was used for the remainder of the state. Building code evolution has been paralleled by the development of the wind load standards referenced in the building codes. The American Society of Civil Engineers (ASCE)-7 wind load standards provide guidance regarding the design wind speeds that should be used to develop the design wind loading conditions for structures. Across the spectrum of building codes and corresponding load standards, when we look at the design wind speeds that govern the design and construction of structures in the Florida Panhandle, we see that these vary between 120 and 140 mph 3-second gust values. Given that portions of the Panhandle were subjected to wind speeds in excess of this design level during Hurricane Michael, significant damage is expected to the building stock there.
Another interesting aspect germane to the area is the presence or absence of opening protection. The evolution of the windborne debris region (WBDR) in the Panhandle is unique in Florida. Prior to the adoption of the first edition of FBC in 2001, opening protection (i.e., hurricane shutters) was not required. With the adoption of FBC 2001, areas in the Panhandle designed to 120 mph gusts were exempt from the WBDR except for areas within 1 mile of the coast. In 2004 that exception was removed and protection was required for all new buildings in the 120 mph+ region. With the adoption of the 2012 FBC there was a change in the design wind speed formulation based on ASCE 7-10. As a result, the Panhandle saw further large reductions in the WBDR regions.
Another point specific to this storm was the speed at which it intensified and moved north. These factors limited the amount of preparation time available to install protective devices even if the property had shutters available. We can expect to see many windows left not protected from debris.
Widespread devastation being reported in Mexico Beach, Panama City, and many other communities. Even well-engineered buildings, such as the Bay Medical Sacred Heart Hospital in Panama City, are reporting extensive damage due to windows being blown out, exterior walls cracking, and roof damage.
Florida Exposure at Risk
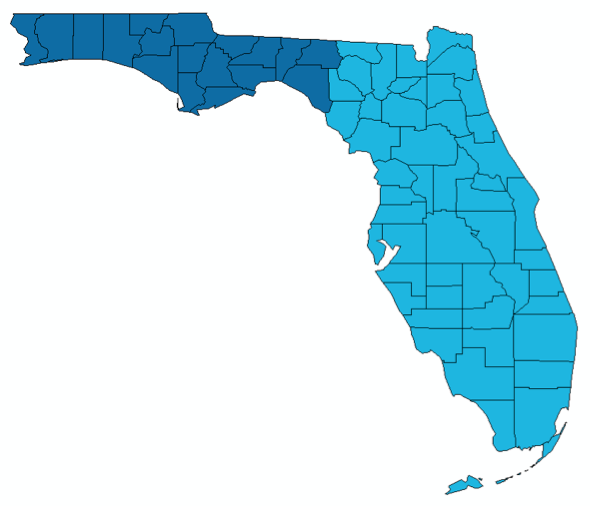
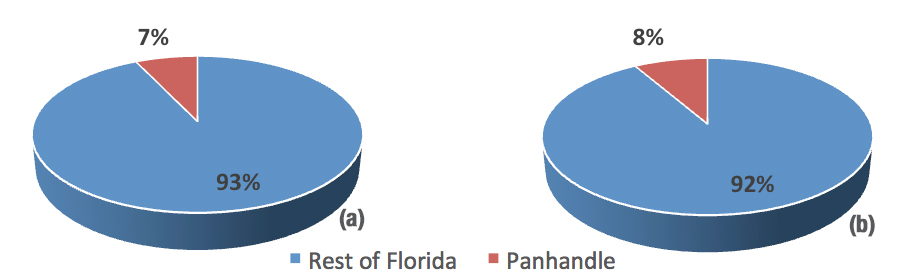
The Panhandle consists of the 18 counties shaded in dark blue in Figure 1. Three of the central counties in the Panhandle—Liberty, Franklin, and Wakulla—are located to the east of the landfall point in areas that experienced high wind speeds and have large areas devoted to state and national forests; and therefore, they include a relatively low number of risks when compared to other regions in the state. Overall, the Panhandle contains less than 10% of the total risk, by replacement value, in the State of Florida. The region also contains less than 10% of the total number of single family and manufactured homes in the state. These breakdowns are shown in Figure 2.
AIR estimates there are approximately 450,000, 155,000, 945,000, and 722,000 homes in Florida, Alabama, Georgia and South Carolina, respectively, which will be affected by Hurricane Michael’s damaging winds (tropical storm strength, i.e., 40 mph and above). The estimates for risk counts and building and contents replacement values are based on NHC's tropical storm-force wind probabilities exceeding 70% at the time of landfall on Wednesday, October 10.
AIR estimates there is approximately USD 217 billion, 69 billion, 432 billion, and 331 billion of exposed value—including residential, commercial, automobiles, and other lines of business—in Florida, Alabama, Georgia, and South Carolina, respectively, which will be affected by Hurricane Michael’s damaging winds (tropical storm strength, i.e., 40 mph and above).
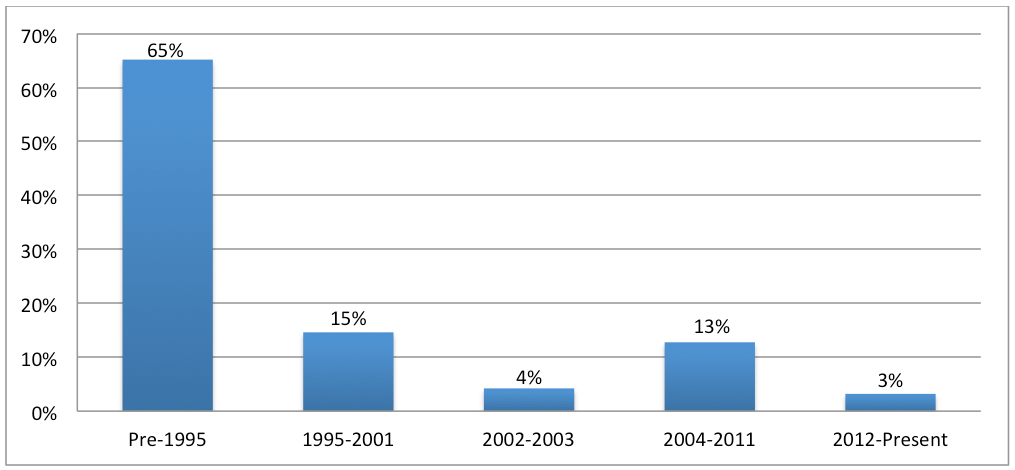
A deeper dive into the residential exposures in the Panhandle shows that most risks in this area were constructed before 1995 and were therefore designed using the SBC, which was a pre-Andrew building code. This older building stock is expected to sustain much more damage than newer stock. Less than a quarter of the residential risks in the Panhandle were designed using a version of the FBC, and those built within the years 2002-2003 were designed using a code that did not require window protection.
While this blog post focused extensively on the nature of expected damage, we will report our findings about building performance following our damage survey in the affected areas in future blog posts.
To learn more read the blog “Which Hurricane State’s Best with Building Codes? One Guess!”
