At its core, AIR is a catastrophe modeling company. The risk that natural disasters and other catastrophes pose to the insurance industry is at the forefront of our research and products. However, we also realize that catastrophes are not the only challenges faced by insurers-there are many situations where non-catastrophic sources of loss are key to truly understanding the entire risk profile.
Many direct and facultative accounts are written on a so called "all risk" basis, and to price such a submission, all aspects of loss must be properly measured. Similar situations arise in treaty reinsurance or in the periodic reporting of managing general agents with binding authority.

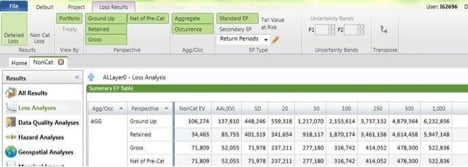
A Touchstone screenshot showing non-cat losses in one results option, Loss Analyses
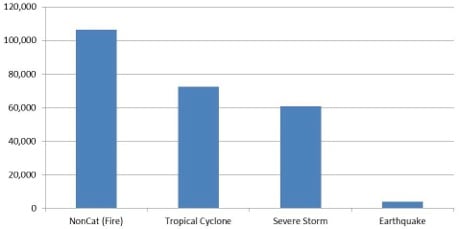
But a quick first step would be to look at total ground-up annual expected loss. I've done this by running the catastrophe models for Tropical Cyclone, Severe Storm, and Earthquake and then using the ISO Advisory Loss Costs to calculate the non-catastrophe expected losses (in this case I've used the BGI, or Basic Group I, loss costs, concentrating on fire and associated perils).

Each peril's contribution to the account's expected average annual loss.
A good way to visualize this is with a bar chart like the one above, one that shows each peril's contribution to the total expected loss. Looking at this graph, it is clear that the non-cat portion of the average annual expected loss accounts for nearly 50% of the whole.
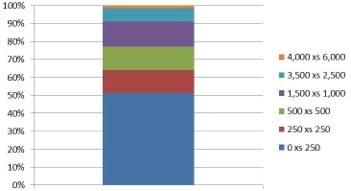
I can now broaden my view and look at layers of coverage. I've created several hypothetical layers that, together, cover most of the insured value of the submission. Again using Touchstone, I then determine the amount of ground-up loss that is covered by each layer. For the non-catastrophe losses, this was done using the ISOP SOLD™ curves

Ground-up expected loss by Layer of Coverage
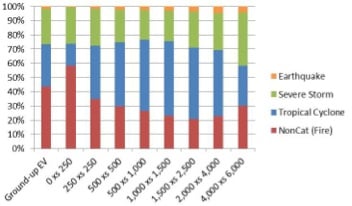
As to be expected, the higher layers have lower expected losses. If I expand the bars once again to show the contributions of each peril, I'll see the following:

The contributions to layer losses by peril
This shows things in a slightly different light. I can see that for the lowest layer, the non-cat losses make up the majority of the total and, as to be expected, this contribution decreases as I get into the higher layers. But even so, the non-cat remains a significant portion of the total-almost a third of the highest layer I analyzed.
This was an admittedly simple example, but it clearly shows the importance of the non-cat perils to the overall risk profile of any group of properties. Thus the new functionality in Touchstone V2.0-that is, the ability to perform both cat and non-cat loss analyses within a single platform-is very welcome.
I'll be expanding upon this topic in an upcoming post, so there's more to come!
