In the winter of 2015/2016, three consecutive storms—Desmond, Eva, and Frank—brought severe flooding to the UK. The cumulative flooding from these storms lasted more than a month and caused approximately GBP 1.1 billion in damage. This cluster of flood events raised the issue of hours clauses, which have been extended during recent reinsurance renewals. Hours clauses enable insurers to aggregate claims for a consecutive period of time for coverage under their reinsurance contracts. Insurers are thereby able to claim the loss across multiple events or for part of a long-lasting event (more typical for regions like central Europe that experience multiple-week flooding).
The longer the hours clause, the larger the potential claim an insurer can make under their reinsurance contract. For inland flood in the UK, the typical hours clause on reinsurance contracts used to be 168 hours (7 days). Recently, however, this has been significantly extended due to the softening reinsurance market; the most commonly used hours clause is now 504 hours (21 days) in reinsurance renewals for UK primary insurers.
Portfolio Sensitivity to Different Hours Clauses
AIR studied the impact of the increase in the hours clause on the industry exceedance probability (EP) curve for Great Britain Inland Flood. Using the results from that study, we can now provide scaling factors that can be used to investigate the sensitivities of a portfolio's modeled losses to different hours clauses.
The study employed a "moving window" approach to create an occurrence EP curve where the moving window aggregates losses from all events within a specified window of time. In contrast to the existing approach of creating the EP curve, where the maximum event loss is chosen as the occurrence loss for that year, the moving window approach defines the maximum moving window's loss as the occurrence loss.
Generating the Occurrence EP Curve
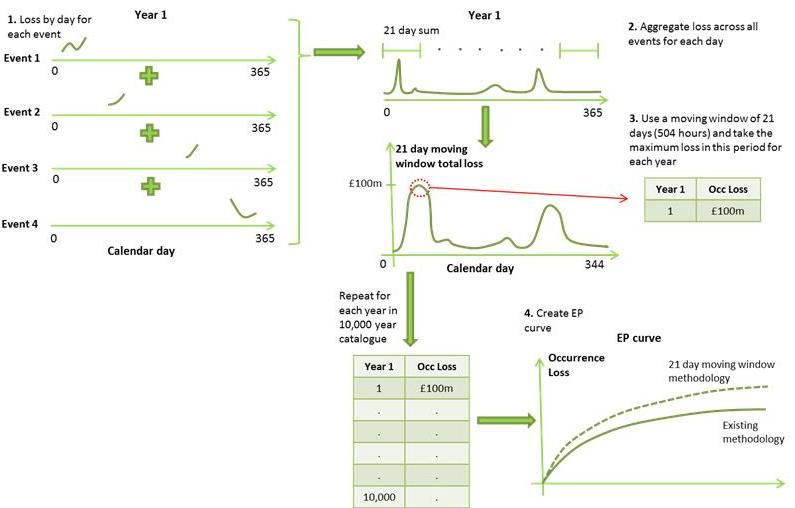
AIR's unique approach to catalog generation within Touchstone® assigns a calendar day to each event loss. In the exercise described here we expanded upon this by using the loss by day for each event from AIR's internal research model.
Losses across all events for each day of each year were aggregated. This generated a time series of loss from day 1–365 (for those days with no event loss, GBP 0 was assigned). To find the maximum loss within 21 days for each year, a window of 21 days (the first window is day 1–21, the second window is day 2–22, and so on) was moved throughout the year, with all losses occurring within the 21 days being summed. The maximum 21-day total loss was taken as the occurrence loss for the year. The process was then repeated for each of the 10,000 years in the model's catalog to generate the occurrence EP curve. Multiple "moving window" sizes ranging from seven to 30 days were tested and EP curves were created using both the established AIR method and the moving window technique.
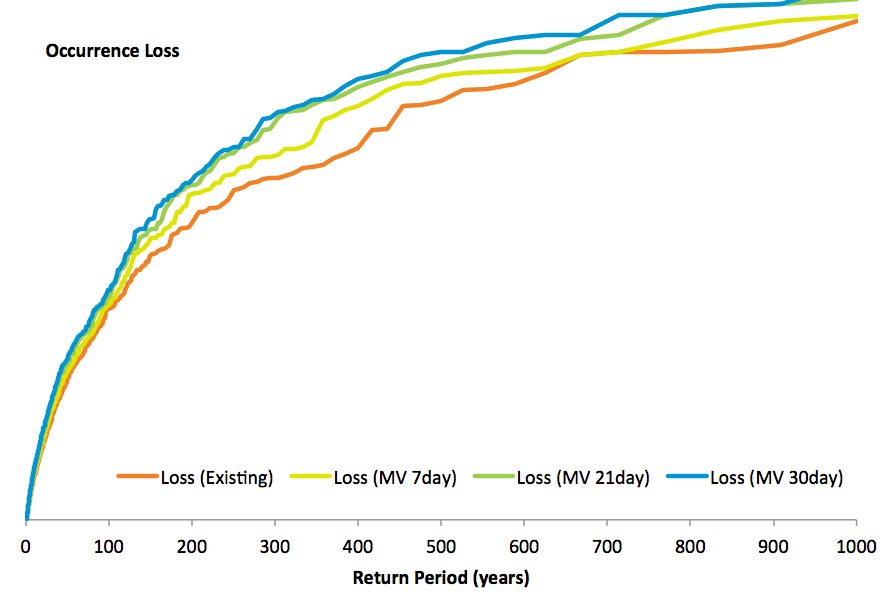
The EP curve created using the existing method is reasonably close to the EP curve created using the 7-day (168 hours) moving window. This was expected because the 168 hours clause was used to separate the precipitation events in the AIR Inland Flood Model for Great Britain. The two curves do not, however, match exactly because event separation in the existing method is based on precipitation whereas it is based on loss in the moving window method, and the start of the precipitation does not always equate to the start of loss.
In the occurrence EP curves shown above, the occurrence loss increases as the moving window size is extended from seven to 30 days. Again, this is not a surprising result since, as the moving window size is increased, it is more likely that more losses will be aggregated. The percentage increases relative to existing modeled occurrence losses are shown below. These can be used as scaling factors to test the impact of increasing hours clauses on losses at different return periods.
| Increase compared to existing occurrence loss—21 day hours clause | Increase compared to existing occurrence loss—30 day hours clause | |
|---|---|---|
| 200-year return period loss | 13% | 14% |
Note that these specific scaling factors are based on AIR's industry EP curve; for highly localized portfolios or specific lines of business, the factors may vary. Nevertheless, these factors offer companies the flexibility to evaluate changes to EP curves with different hours clause assumptions.