Each summer, the threat of wildfire flares up across much of the western United States. Already, "Significant Wildland Fire Potential" is forecast to be above normal in much of California, Oregon, and Washington throughout the summer months.
These fires can be extremely costly, on both an aggregate and an occurrence basis. In 2012, for example, some 38 catastrophic wildfires in the U.S. produced USD 1.1 billion in economic losses-about half of which were insured, according to estimates in a January 2013 report from Munich Re.
This summer, companies can monitor and quantify their risk from wildfire activity using Touchstone's® Geospatial Analytics Module. Using a California wildfire from last year as a case study, let's see how.
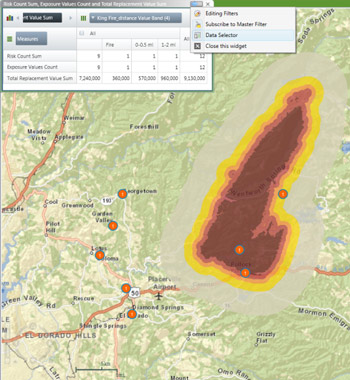
The King Fire as of September 18, 2014, with a set of exposures from a hypothetical company (Source: USGS)
In mid-September 2014, the King Fire exploded east of Sacramento. By the time it was 100% contained almost a month later,nearly 100,000 acres, 12 homes, and 68 other minor structures had been consumed by flames.
While the fire was still growing, the USGS's Geospatial Multi-Agency Coordination (GeoMAC) website provided real-time wildfire footprints. The footprints can be analyzed against a company's portfolio in Touchstone to quantify how many exposures fall within the burn perimeter itself, as well as within user-defined distance bands ringing the perimeter (to calculate potential losses if the fire were to grow, for example).
Because Touchstone's GIS capabilities are fully integrated with its financial module, we can apply policy terms to accumulate exposed limits, not just replacement values. While, in the U.S.,AIR currently offers a wildfire model only for California, a similar analysis can also be done for any other state-and with historical wildfire footprints, as well.
While managing the risk from actual events in Touchstone is one of its many benefits, proactively managing wildfire risk is the best course of action, and here the Geospatial Analytics Module can help too.
We know, for example, that vegetation fuels wildfires. AIR's California wildfire model relies on a high-resolution vegetation(or fuels) database. But for non-modeled states, we can still quantify wildfire hazard independent of an actual event by adding vegetation data from a third-party provider (in this case Wildland Urban Interface data from the SILVIS Lab at the University of Wisconsin).
The image below shows the city of Colorado Springs, Colorado. We've overlaid a hypothetical portfolio of exposures on SILVIS vegetation data. Exposed gross sums and replacement values can be calculated for different types of vegetation, enabling users to determine how much of their portfolio is located in high-risk and low risk-zones. Companies can use this information to set better underwriting guidelines and avoid overexposure in areas of high hazard.
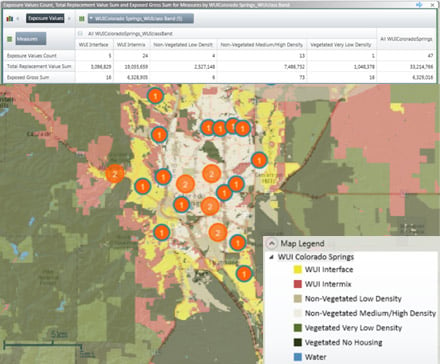
Vegetation data for the city of Colorado Springs, shown with hypothetical company exposures
(Source: SILVIS, USGS, AIR)
Wildfires pose considerable risk to companies with exposures in both modeled and non-modeled states. Touchstone's Geospatial Analytics Module can help companies quantify the risk from these and other deadly and unpredictable catastrophes-before, during, or after an event.