
China's economy has developed dramatically in recent years, and this has been reflected in a spectacular burst of construction. In response, the insurance market in China has grown rapidly. Significant exposure growth in residential and commercial lines has been observed, as well as a sharp rise in industry infrastructure and other property lines. Meanwhile, several catastrophic typhoons have made landfall in China and caused major insured losses.
Benefiting from a wealth of new data from recent events and the latest research, AIR’s Typhoon Model for China has been updated. The release includes new historical events, changes to hazard intensity and vulnerability functions, as well as support for additional structures such as industry facilities. All of these will be discussed in forthcoming blogs, and in this post we’ll focus on historical events.
More and Better Data
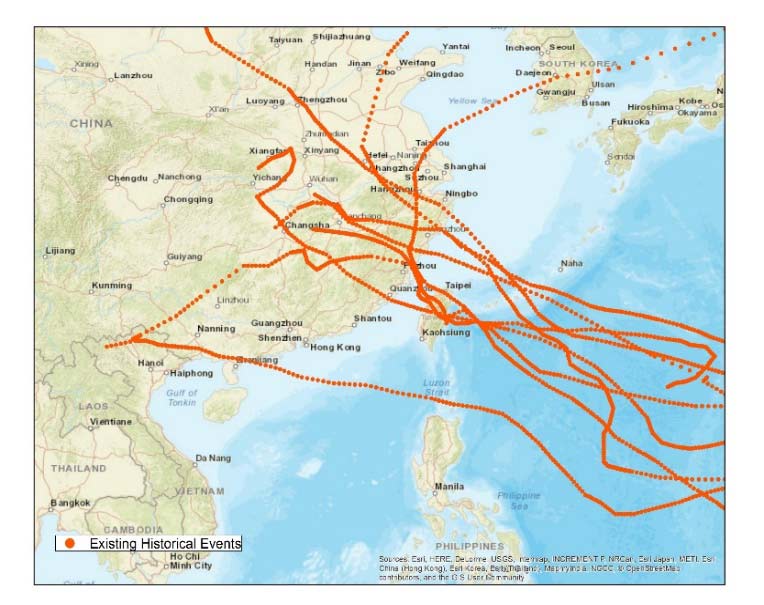
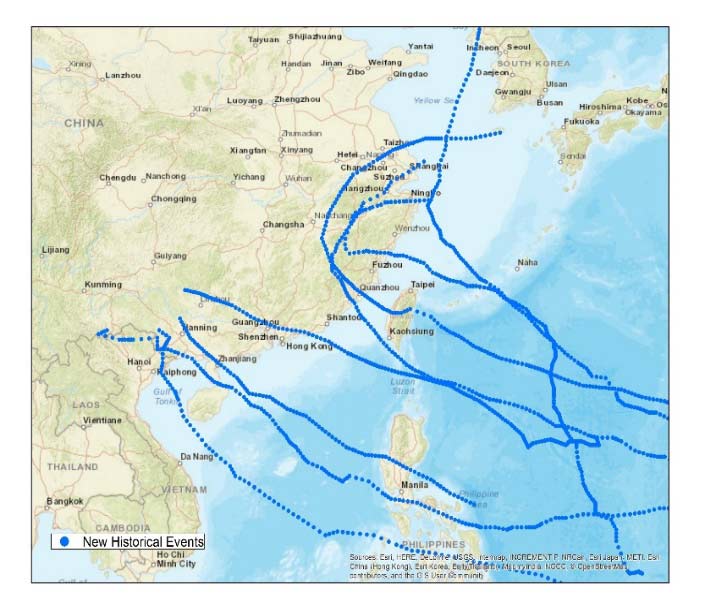
In this update, AIR researchers have used more historical events and more data to validate each component and the entire model. We added eight new typhoon events into our existing historical catalog (Table 1 and Figure 1). For each of these historical events our researchers studied numerous data sources and created the event with hazard attributes for the catalog.
Let’s take Typhoon Fitow as an example. Fitow made landfall at Fuding City, Fujian Province, on October 7, 2013, and caused combined insured losses of around USD 1 billion for China and Japan according to various reports. It was one of the costliest events in the history of Chinese insurance . Fitow delivered tremendous precipitation hundreds of kilometers away in Zhejiang Province, but all agencies stopped publishing observed tracks soon after its landfall. To properly model this event, our researchers traced and extended the track of Fitow to better capture its destructive precipitation, which was enhanced by that from Typhoon Danas a few days later.
| Existing Events | New Events | ||
|---|---|---|---|
| Event | Year | Event | Year |
| Wanda | 1956 | Haikui | 2012 |
| Nina | 1975 | Usagi | 2013 |
| Winnie | 1999 | Fitow | 2013 |
| Rananim | 2004 | Rammasun | 2014 |
| Haitang | 2005 | Chan-Hom | 2015 |
| Bilis | 2006 | Soudelor | 2015 |
| Saomai | 2006 | Mujigae | 2015 |
| Hagupit | 2008 | Meranti | 2016 |
| Morakot | 2009 | ||
For this update, we collected exposure data from companies representing 60-70% of China premium and observed insured loss for these historical events. We trended AIR’s industry exposure database (IED) to the end of 2016 and developed a new take-up rate to derive an insured IED. The new information provided the basis for our model validation from both the industry and company perspectives.
After validating simulated and observed wind speeds at landfall we calibrated the model output against observed historical event losses and their return periods. During this process, it was important to clean reported losses to exclude losses from non-modeled lines, such as life, agriculture, and auto because only residential, commercial, industrial, and engineering are modeled lines in the AIR IED for the China typhoon model. Trending observed losses was also important to ensure that the loss generated in the model corresponded with exposures. Figure 2 is a summary of company combined modeled and observed events loss comparison.
We are aware that every company has its own daily practices and that there are significant differences in risk selection, underwriting, protection, and claim processes. Although the AIR model is calibrated and validated by industrial and selected companies’ exposures/losses (such as shown in Figure 2), the updated model may still produce modeled loss that is different from actual loss for a specific portfolio. It is recommended that you run the model with your book of business and evaluate the model results for historical events so that model outputs appropriately capture your risk.