The Importance of Planetary-Scale Motions for Modeling Local Weather Extremes
Sep 08, 2020
Editor's Note: This article is the second in a series about a project AIR has undertaken to establish a new framework for modeling and managing climate change risk for the coming decades—one rooted in high quality data and deep domain knowledge of weather and climate physics. In the first article in this series AIR’s Chief Research Officer Dr. Jayanta Guin discussed the motivation for this multi-year investment.
In Part I of this series, we discussed the importance of being able to model not only the physics of a weather system itself, but the physics of the larger, planetary-scale circulations that operate on longer time scales—the climate dynamics. For example, to better model the risk of a Hurricane Harvey-like event occurring in Miami rather than Houston, it is important to also be able to model the physics in a place such as, say, Manhattan.
The distinction between weather and climate has been stated in the following ways: Climate is what you expect, weather is what you get; weather is your mood, climate is your personality; climate lasts and weather doesn’t. They all convey the same message—that climate is an amalgamation of weather over a long period of time. But climate is more than that. Understanding what climate really is from an atmospheric dynamics perspective is critical to improving catastrophe models. That is what this article is about, how climate is inherently the cause of weather and weather variability, and the real driver behind weather extremes—not the end result of weather. At the same time, it is important to understand that climate and weather are inextricably connected.
Climate’s Large- and Small-Scale Atmospheric Motions and the Weather They Generate
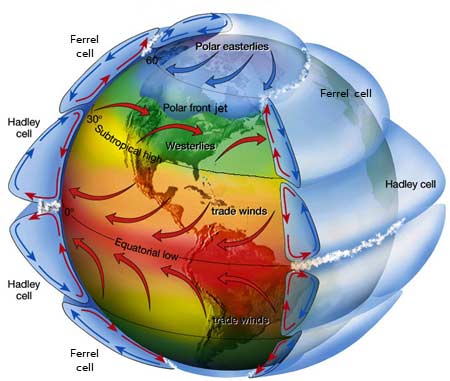
The climate that any given region on Earth experiences is determined largely by its latitude. But latitude means more than just how far away from the equator a location is and how directly the sun’s rays reach the Earth’s surface. Latitude also influences whether prevailing surface winds blow from the east (easterlies) or from the west (westerlies) and how strong they are. At midlatitudes, which are typically defined by the range of 30° to 60° north or south of the equator, prevailing winds are westerly (see Figure 1). These westerlies are the result of southerly winds in the Northern Hemisphere associated with the Ferrel cell—the middle cell of three pole-to-equator cells and responsible for equalizing heat imbalances—being deflected eastward by the Earth’s rotation. In other words, in the Ferrel cell, air flows poleward and eastward near the surface and equatorward and westward at higher altitudes; this movement is the reverse of the airflow in the Hadley cell, another of the pole-to-equator cells.
At upper levels, these westerlies are guided by the polar jet stream. The jet stream and the six to eight large-scale waves along it owe their existence to the pole-to-equator temperature difference, or gradient, as well as to the Earth’s rotation. When the temperature gradient is large, the jet stream is faster and straighter; when the gradient is smaller, the jet stream slows and begins to meander, becoming wavier. And not only does the air move through the wavy pattern, the waves themselves move.
Rossby Waves
These waves are known as Rossby waves (see box) after the meteorologist Carl Gustaf Rossby who discovered them in the 1930s:
- Very long waves the size of continents can move slowly eastward or westward at mid-latitudes—or remain stationary; these long waves can therefore influence weather patterns that last an entire season or longer
- Shorter waves—with wavelengths the size of low-pressure systems such as winter storms—do move from west to east
- In the tropics, waves of all wavelengths move east to west
The movement of these waves alone accounts for much of the weather variability for a given region. Storms approach; clouds, wind, and precipitation develop; skies clear. It’s a typical winter weather pattern in the midlatitudes.
But the waves don’t move in isolation; they interact, non-linearly at times and through positive feedback mechanisms. Non-linearity means that as waves phase together (e.g., the ridges or troughs of the waves align) the resulting amplitude can be greater than the sum of the individual wave amplitudes. Furthermore, what happens at the Earth’s surface can greatly influence the motions above and vice-versa.
 Peter Sousounis, Ph.D.
VP and Director of Climate Change Research
Edited by Sara Gambrill, CEEM
Atmospheric Blocks
Sometimes, these interactions can cause an atmospheric block—one that prevents weather systems from proceeding along their “preferred” path. An omega block is one example. It is so called because the flow of air around the resulting Low-High-Low or L-H-L pressure pattern resembles the Greek letter (capital) omega Ω. The rightmost panel in Figure 2 illustrates such a block (designated by H) preventing a low-pressure system (designated by L) from moving directly eastward. Instead, the low is forced to go northward around the block.
Blocks can develop quickly, within a matter of days, but can last for weeks to months. Although they typically form in spring and fall as residual cold or warm air is injected equator- or poleward, respectively, blocks are most impactful in winter and summer because temperatures are more extreme then. Blocks can also affect hurricane tracks; they were influential for Hurricane Sandy’s famous left hook into New Jersey in 2012 and for Hurricane Harvey’s stall over Houston in 2017.
Extreme Events
The formation and dissipation of blocks are difficult to forecast and they can be self-sustaining. A good example is what happened over Australia in late 2019, just ahead of the 2019-20 bushfires, which destroyed 10 million hectares (~25 million acres) and destroyed more than 2,600 homes, mainly in Australia Capital Territory, New South Wales, Queensland, South Australia, Tasmania, and Victoria. Earlier in the summer of 2019, one of the strongest positive phases of the Indian Ocean Dipole developed to cause a drought in western Australia. Less rain meant fewer clouds, enabling more sunlight to heat the ground. As surface temperatures rose, the wind pattern aloft responded accordingly—causing a southward bulge in the steering currents so that any rain systems approaching from the west were diverted to the south of the continent. That allowed yet more sunlight to reach the ground, perpetuating the pattern. An intense sudden stratospheric warming episode further exacerbated atmospheric conditions for bushfire.
What happened over Australia during their springtime is an example of an extreme climate pattern: complex and large in scale, it influenced weather and weather-related phenomena for months. To accurately model extreme weather phenomena, such as the 2019-20 Australia bushfires, one has to be able to model extreme weather patterns and the dynamics that cause them.
Another way blocks, or stagnant weather patterns, can form is when Rossby waves get trapped, stall, and amplify. Some recent studies have suggested a link to climate change, that is, as the pole-to-equator temperature difference decreases, the trapping and resonance of waves will occur more frequently. Not only drought, as in the case of the bushfires, but extreme flooding can also occur, as wet weather systems follow one after another over the same region, like railroad cars on a train track. When these tracks set up from southwest to northeast across oceans, atmospheric rivers can develop to transport up to 15 times more moisture than the Mississippi River can—to the west portions of continents. These high-amplitude, nearly stationary (in time) patterns have been used to explain the devastating 2003 heat wave in Europe that claimed 70,000 lives, as well as more recent events such as the 2010 Pakistan flood/Russian heat wave, the 2011 Texas drought, the 2013 European floods, the 2015 California wildfires, and the 2016 Alberta wildfires. A prolonged atmospheric river event in mid-December 2010 fueled strong winter storms that battered the U.S. West Coast with up to two feet of rain and provided 75% of the Sierra Nevada’s annual snowpack before winter even started. These are all examples of extreme climate patterns—extreme in the sense that, historically, they haven’t happened very often and they resulted in significant consequences. Global climate models suggest, however, that the sort of resonance, or increased amplitude, that gives rise to such events will happen 50% more often.
While altered (e.g., blocked) flow patterns can lead to extreme weather events reaching areas that don’t normally experience them, the intensity of the weather event can also reach unprecedented levels. As previously noted, as waves interact, they can resonate and grow in amplitude. Thus, a short wave moving through a long wave can grow in intensity dramatically, or explosively, especially as clouds are forming and releasing latent heat. The term explosive deepening applies to a low-pressure system whose central pressure decreases by as much as 24 mb in 24 hours. Such “bomb” cyclones are not new (the term was coined back in the 1970s), but they may be occurring more frequently because climate change is allowing more moisture in the atmosphere and more latent heating to occur.
Ocean-Atmosphere Interactions Add Complexity: The El Niño/La Niña Southern Oscillation (ENSO) Example
So far, we've discussed how atmospheric motions on different scales can interact to yield extreme weather. The long wave patterns themselves can be influenced by other dynamics that involve both the atmosphere and the ocean. Some of these dynamics repeat themselves with some frequency, which has led to the identification of a large number of climate signals, or climate factors. They are so called because they influence atmospheric motions on large (continental) scales and may do so either continuously or with some quasi-periodicity. The climate signals can also interact with weather.
The interaction of climate and weather is demonstrated most readily by considering a familiar climate phenomenon. The El Niño Southern Oscillation (ENSO) is an atmospheric-oceanic phenomenon that affects weather worldwide. The Southern Oscillation is the atmospheric part, but the oceanic part (El Niño) is what gets more attention. ENSO manifests on a time scale of three to seven years, meaning that in that period at least one weak El Niño and its counterpart La Niña will probably have affected Earth. The strength of each phase is typically measured by how anomalously warm (El Niño) or cool (La Niña) a region of the central-to-eastern tropical Pacific is over a three-month period.
During an El Niño for example, the warm water that is normally largely confined to the western Pacific shifts eastward, sometimes all the way to the west coast of South America. (The phenomenon got its name, which means “the boy” or “the Christ Child” in English, owing to its appearance being most noticeable at Christmastime.) The eastward transport of warm water implies that the ocean gets involved. It also implies that the normally reliable easterly trade winds, which are what typically hold the warm water in place in the western Pacific, relax or even change direction. The absence of offshore winds along the west coast of Peru during El Niños can halt the fishing industry there; the absence of offshore winds means no upwelling of cooler water, no bait fish, and hence no big fish.
But the water doesn’t just shift eastward on its own. Intense thunderstorm activity (weather) in the western Pacific is the precursor to an El Niño. This intense convection triggers the eastward transport of warm water just below the surface along the equator. Once the warm water reaches Peru, it spreads northward and southward along the west coasts of the Americas. El Niños have significant impacts on tropical cyclone activity, severe thunderstorm activity, and overall precipitation patterns over much of the world.
For example, during an El Niño, hurricane activity is typically reduced over the north Atlantic because of increased vertical wind shear and increased over the eastern and western Pacific owing to a larger expanse of warm ocean water. Because warm water is the fuel for not just tropical cyclones but precipitating weather systems in general, the west coasts of the Americas typically get increased rainfall and even flooding conditions. In contrast, much of Asia as well as eastern Australia can experience drought conditions. Food stocks can decrease and famines start in eastern Africa as crops start to fail, potentially leading to unrest. La Niñas can also bring such spatially correlated weather but in a different way. Atlantic hurricane activity is typically above normal, for example, while the Pacific tropical cyclone seasons are below normal. Heavy rains characterize eastern Asia, especially.
Climate in the Context of the Catastrophe Model
The periodicity of ENSO suggests that an appropriate time scale with which to define climate should allow for at least several such events. Indeed, the standard length over which weather is averaged to reflect climate is 30 years. While this length of time might at first glance suggest the appropriate data vintage for developing catastrophe models, one must consider that other climate factors, such as the Atlantic Multidecadal Oscillation (AMO) and the Pacific Decadal Oscillation (PDO), have even longer time scales. The former has a period of about 44 years, although the last full AMO cycle began in 1962 with a negative phase and the complementing positive phase that started in 1995 has not yet been completed. Despite the “decadal” in its name, the PDO is typically associated with a 50-year cycle. None of these numbers, of course, is as precise as suggested here; there is a natural variability in the periodicity of these climate signals.
Perhaps, then, 60 years is a sufficiently long period with which to define climate? Probably not, considering that climate signals interact. The convective activity in the western Pacific that can trigger ENSO is caused by the Madden Julien Oscillation (MJO), which operates on a time scale of 30 to 60 days. In fact, it’s quite possible that a particular weather regime that a climate factor combination might generate naturally has not yet been observed. For a catastrophe model, the appropriate record of historical data will depend on the variable of interest. This also speaks to the reason why the last few years of extremes may not be a predictor of what is to come: short-term trends can be misleading.
Pulling the question of climate time scale in a completely different direction is the existence of anthropogenically induced climate change. The fact that the Earth’s temperature has increased by more than 1°Celsius in just the last 70 years as a result of increased greenhouse gases means we cannot just take data over a very long period to try to account for all possible natural climate interactions without somehow also accounting for climate change because not only is climate itself complicated, the very definition of it is too.
What Can General Circulation Models (GCMs) Do?
The climate’s atmospheric and oceanic motions and the extreme weather they can generate—specific combinations of which may have yet to occur—are complex and interconnected. The factoring in of climate change as it evolves makes for a convincing case that building catastrophe models from historical data alone, or even the statistics of that data, may leave gaps that affect a model’s ability to appropriately represent extreme weather events, if not in the near future then certainly in the more distant future. How might the climate factors of most importance to the catastrophe modeler, for example, be altered by climate change?
One way to fill such gaps is through the more explicit use of general circulation models (GCMs) to model the actual physics of Earth’s climate system and thereby account for outcomes that have not yet been observed—such as a Hurricane Harvey stalling over Miami, or even Manhattan. To see where and how far GCMs can take us, we must examine in some detail what such models can and cannot do, and why, which is what will be discussed in the next article in this series.
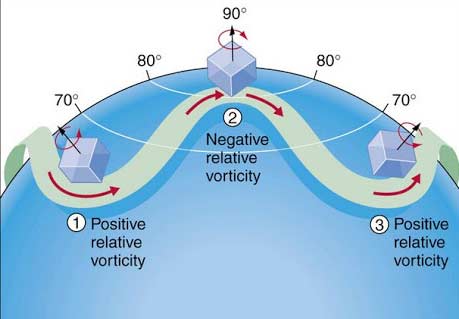
Rossby Waves
Any given parcel of air has two kinds of spin or vorticity. One is the kind we see, like air rotating counter-clockwise in the Northern Hemisphere around a hurricane, called relative vorticity, and planetary spin, which is like potential spin that we can’t see. Planetary vorticity is zero at the equator and largest at the poles. As air moves, it has to conserve the total or absolute vorticity it started with. As air moves northward from Position 1, its relative vorticity decreases as it gains planetary vorticity. This causes the air to begin to rotate clockwise more, which results in the parcel eventually moving southward at Position 2 as it is moving eastward. As it overshoots the latitude it started at, the parcel now loses planetary vorticity but gains relative vorticity. This eventually causes the parcel to move back north again at Position 3. Thus, a wavelike motion is traced out by the parcel—forming a Rossby wave (green ribbon). The wave itself can move slowly in either direction or remain stationary, depending on its wavelength and how fast wind moves through the wave. Figure below from homework.uoregon.edu.