


Managing U.S. Flood Risk: Part I, Modeling Hurricane-Induced Precipitation
Feb 11, 2020
Editor's Note: Editor's Note: AIR Currents is featuring a four-part series on modeling and managing U.S. flood risk. This first article focuses on the additional capability of managing hurricane-induced flood risk with the updated AIR Hurricane Model for the United States. Part II will discuss the new pluvial component of both the updated U.S. hurricane model and the AIR Inland Flood Model of the United States; Part III will discuss AIR’s enhanced view of flood vulnerability; and in Part IV we will quantify U.S. flood risk from all sources—tropical and non-tropical precipitation and coastal storm surge—for all lines of business as we transition from an insurable ground-up view to an insured gross view of flood risk. The updates discussed in all parts of this four-part series are anticipated for release this summer.
The 2017 and 2018 Atlantic hurricane seasons set records for precipitation and highlighted the impact hurricanes can have on flooding events in the United States. In August 2017 Hurricane Harvey was the wettest storm to flood Texas, and in September 2018 Hurricane Florence set the record for wettest tropical cyclone to impact the Carolinas. While AIR has been modeling the inland flood peril since 2008 and launched the industry’s first probabilistic inland flood model for the United States in 2014, until a few years ago it was not possible to adequately simulate precipitation associated with tropical cyclones. The first model for which AIR was able to develop and employ innovative methodologies that realistically simulated rainfall patterns of tropical cyclones was the AIR Inland Flood Model for Japan in 2017. By leveraging our experience developing this model and using machine learning techniques, we were able to update the AIR Hurricane Model for the United States to include the explicit and probabilistic modeling of precipitation-induced flooding associated with hurricanes and to create a new pluvial component for the AIR Inland Flood Model for the United States. Together our updated U.S. hurricane and inland flood models, anticipated for release this summer, provide a complete and unified view of precipitation-induced flood risk.
This article discusses step by step the innovative ways in which AIR approached the major technical undertaking of mapping unique and realistic spatio-temporal precipitation patterns onto the entire track of each hurricane in our existing U.S. hurricane model’s stochastic catalog.
Using State-of-the-Art GCM-NWP Coupling to Simulate Precipitation
Both large- and small-scale rainfall events of a tropical and non-tropical nature can produce significant loss-causing flood events. To capture a more comprehensive view of flood risk in the U.S., AIR had to create a new precipitation catalog that more closely reflects the natural system, including precipitation from hurricanes as well as all other weather systems.
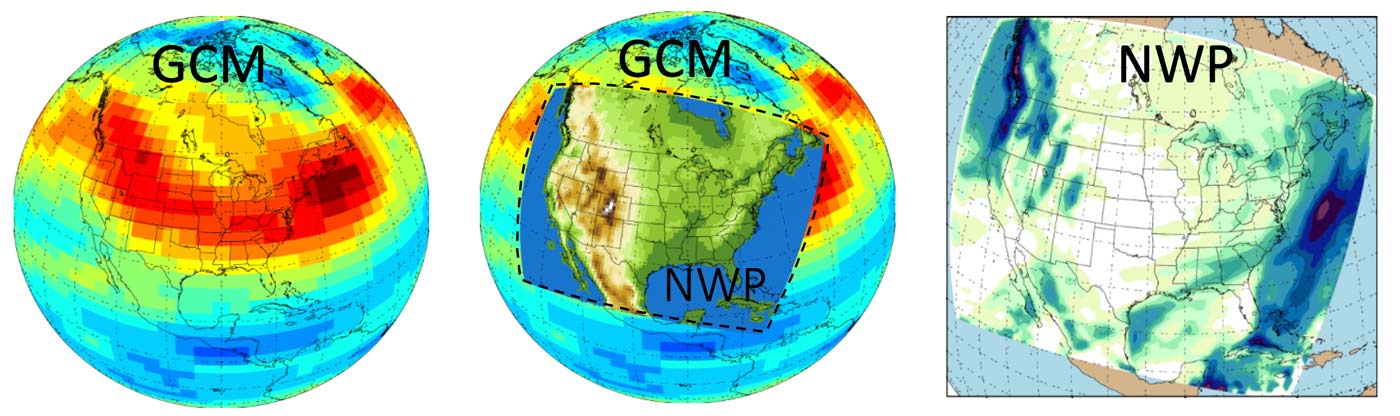
In our current U.S. inland flood model, the precipitation catalog was produced via a coupling of a general circulation model (GCM) to a numerical weather prediction (NWP) model, a common practice in the scientific community. More specifically, first, a coarse-resolution GCM is run for 10,000 years to replicate the near present climate, then using its output to drive a fine-resolution regional NWP model to generate an hourly precipitation field over the whole U.S. (Figure 1). The National Center for Atmospheric Research’s (NCAR) general circulation model, the CESM-CAM, provides the initial and boundary conditions that feed into the high-resolution NWP: the Weather Research and Forecasting model (WRF)1, which is used extensively in the industry for both weather forecasting and climate studies. This high-resolution WRF NWP is then used to simulate precipitation over the United States for 10,000 years. For a unified view of risk, we blended our existing GCM-NWP precipitation with the newly simulated hurricane precipitation with the existing tracks from our existing U.S. hurricane catalog.
Incorporating Hurricane-Induced Flooding into AIR's U.S. Hurricane Model
The 100,000-year stochastic catalog in the AIR Hurricane Model for the United States contains more than 200,000 hurricane tracks; to add hurricane-induced flooding to the model, each of these tracks required unique and realistic spatio-temporal precipitation patterns to be mapped onto them. To meet these challenges, AIR tapped into our successful experience of modeling typhoon precipitation for the Japan inland flood model; using machine learning and big data, we employed a hybrid numerical/stochastic approach that is both physically based and computationally feasible. What follows is an explanation of the steps we took to execute this approach.
Historical Hurricane Precipitation Simulation
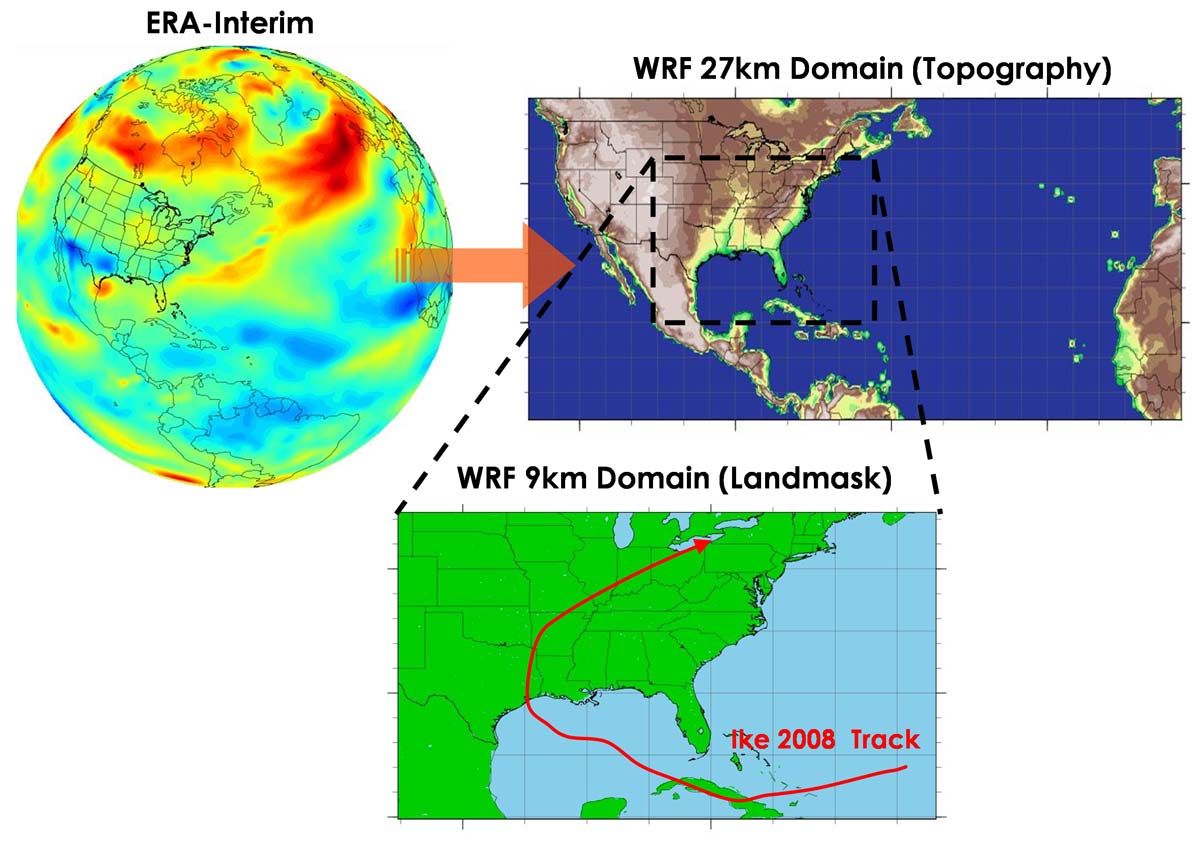
First, using the high-resolution capabilities of the WRF numerical weather prediction model, AIR simulated the precipitation for all historical hurricanes that impacted the United States between 1950 and 2018, including those storms that did not make landfall but brushed or bypassed the coastline close enough to cause rainfall. Figure 2 depicts the framework in which these simulations were completed, where WRF (at 27-km resolution) is driven by the European Centre for Medium-Range Weather Forecasts’ (ECMWF’s) ERA-Interim data set to provide higher-resolution seasonal simulations. These simulations employ grid analysis nudging, which means the WRF simulated fields are corrected to match as closely as possible to the original coarser ERA-I values of the same fields throughout the atmosphere (back to the ERA-Interim results). For each historical HURDAT hurricane that either bypasses or makes landfall on the Atlantic Coast or Gulf of Mexico from 1950 to 2018, a set of high resolution (9-km) WRF simulations are completed. These simulations are event-dependent for both domain size and duration, based on the timing and best track data from HURDAT. In these simulations, only the mid to upper atmosphere (500 mb and higher) are nudged back to the ERA-I reanalysis data set, as explained above.
Ensemble Modeling Approach for Historical Hurricane Precipitation Simulation
To reproduce past hurricane precipitation, AIR ran the 9-km simulations using ensemble modeling, a well-known technique in the weather prediction community. For this ensemble approach, we ran 25 versions of each historical hurricane, starting from slightly different initial and boundary conditions. The initial-condition approach for perturbation of the ensemble members is based on WRF’s Stochastic Kinetic Energy Backscatter Scheme (SKEBS). Analysis was performed to determine the correct levels to nudge and the correct amount to perturb to obtain suitable variance in the ensemble members’ precipitation fields. The ensemble approach allowed us to capture some of the uncertainty around the location and intensity (rainfall rates) of feeder bands—the spiral-shaped bands of convection surrounding, and moving toward, the center of a hurricane—and intensity within the hurricane, especially around the eye wall, where the most intense rainfall typically occurs, as shown in Figure 3.
The overall features of the four different ensemble members—labeled ENS 1, ENS 2, ENS 3, and ENS 4 in Figure 3—look quite similar at first glance, but a closer look will reveal nuanced differences among them, as shown in the middle panels labeled ENS1 – ENS3 and ENS2 – ENS4. The exact locations of the eye wall and feeder bands vary, and their size and shape can be quite different. Such an "ensemble spread" is a good measure of precipitation uncertainty and, more importantly, it facilitates the stochastic perturbations that are subsequently conducted.
We performed ensemble modeling for more than 120 historical hurricanes affecting the U.S., including for Hurricane Harvey. This effort resulted in nearly 800,000 hours of numerically simulated hurricane precipitation—a major computational endeavor that took several months and provides a great example of big data scientific analysis. The resultant outputs served as the training set on which our algorithm learned and simulated hurricane precipitation.
It is important to note that the structure of rainfall patterns in hurricanes varies significantly as a storm evolves in intensity—whether it’s developing, maturing, or dissipating; whether it’s before or after landfall; or whether it transitions into an extratropical cyclone. This variation is evident in the hurricane animations in Figure 3, where we see the overall structure of the precipitation patterns can evolve from axial-symmetric to asymmetric. As a result, it is necessary to analyze the precipitation patterns in 6-hour segments. We assume the structure of precipitation is effectively stationary within those 6 hours, capturing a unique precipitation pattern. The resultant approximately 18,000 segments of high-resolution NWP-simulated precipitation patterns were used to develop our precipitation pattern "dictionary.”
Development of Machine Learning Algorithms to Learn and then Simulate Precipitation along the AIR U.S. Hurricane Model’s Stochastic Tracks
The next step was to develop a stochastic model based on the statistics and patterns of hurricane precipitation. The statistical model learns from the historical events and then simulates patterns of hurricane precipitation along the stochastic tracks in AIR's U.S. hurricane catalogs. The model could then make realistic precipitation pattern choices to match the defining features for the different types of hurricanes, and for different stages within the same hurricane track at each moment in time.
In the initial stage, the sequence of ensemble segments along each track were chosen from the precipitation pattern dictionary. The model uses each stochastic track from AIR’s U.S. hurricane model to determine what type of pattern and intensity of precipitation, according to its relationship to corresponding similar historical track segments from the dictionary. The choice was defined by the segments’ similarity along a set of characteristics and features, including:
- stage of the hurricane (genesis, maturity, dissipation, or extratropical)
- strength of the storm (central pressure)
- spatial structure similarity (using principal component analysis, which simplifies the complexity in high-dimensional data while retaining trends and patterns)
- geographic location
 Marc Marcella, Ph.D.
Principal Scientist
 Daiwei Wang, Ph.D.
Senior Scientist
 Boyko Dodov, Ph.D.
Vice President
Edited by Heidi Carrell, CEEM
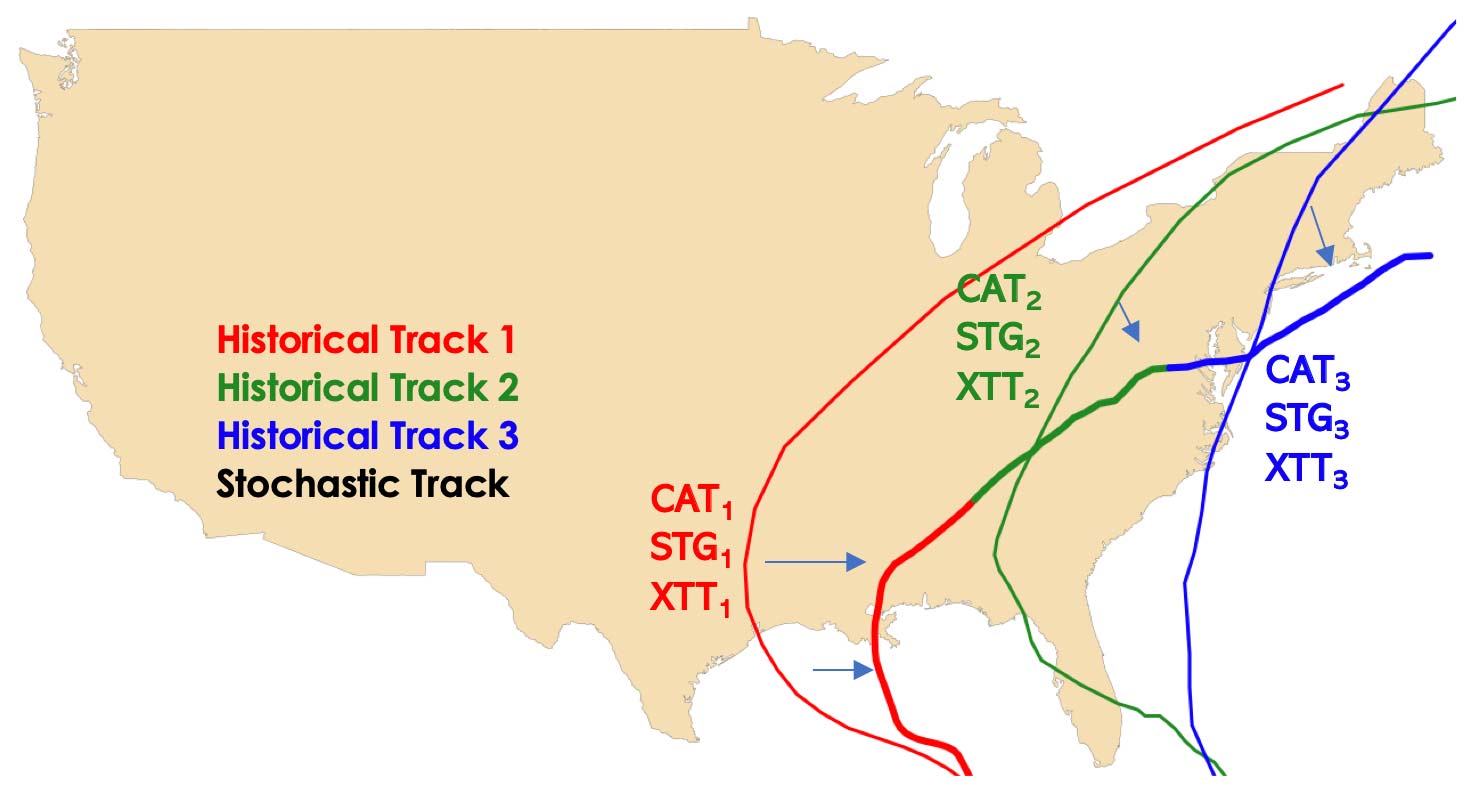
For the genesis, or first segment, of each track, the nearest historical ensemble segment is chosen based on the physical distance between the track parameters. Figure 4 illustrates the process for a single stochastic track and the initial historical hurricane from which it draws precipitation patterns.
For the remainder of each stochastic track, a sequence of segments is constructed from our dictionary of historical tracks from the 25-member ensemble through singular value decomposition (SVD), a matrix decomposition method for reducing a matrix to its constituent parts to make certain subsequent matrix calculations simpler. SVD ensures that the newly generated field in each segment is unique, while maintaining the spatio-temporal covariance structure of the ensemble. The resultant sequence of stochastic samples is finally concatenated using a data assimilation technique to provide a smooth transition along the hurricane’s lifespan with overlap at the last hour of each segment and the first hour of the next one.
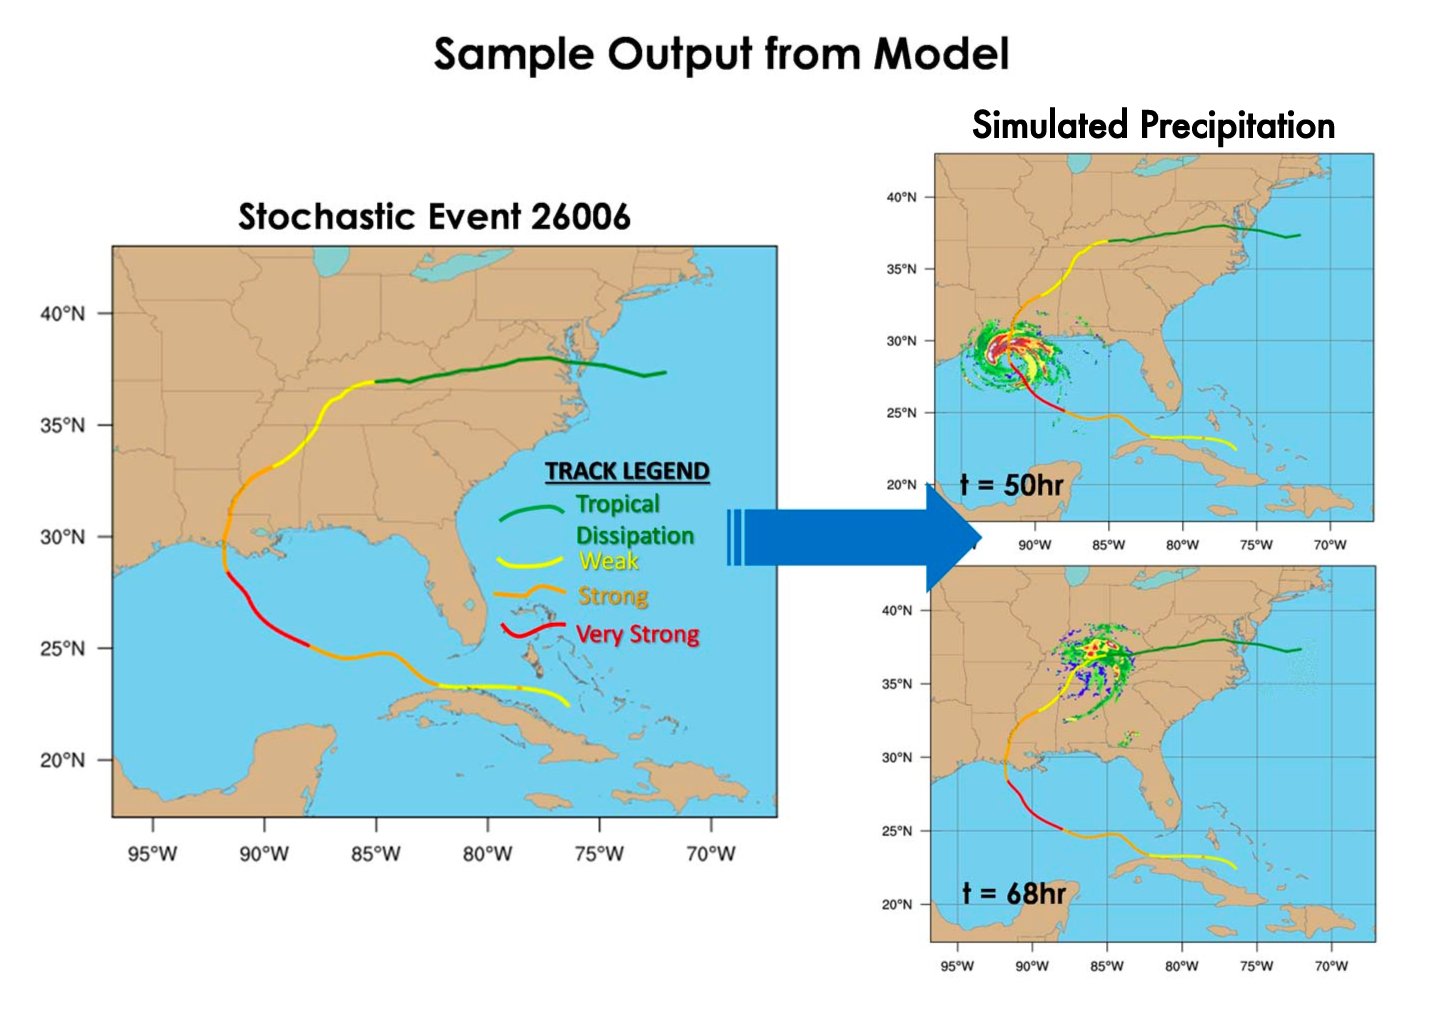
This process—simulating hourly precipitation along the entire track of each hurricane—is run for each of the more than 200,000 hurricanes that make landfall on or closely bypass the East Coast of the United States or the Gulf of Mexico in the 100,000-year stochastic catalog. The precipitation intensities are adjusted to observed hurricane precipitation from the NLDAS-PRISM data set and extreme value statistics. Figure 5 shows an example stochastic event from our catalog, its track according to intensity, and staging with the newly modeled precipitation field both at landfall and after dissipation inland.
Blending Precipitation from All Sources
The final step we took was blending these hurricane precipitation patterns into the non-hurricane precipitation catalog. To do this, if there was any precipitation along the hurricane tracks in each stochastic year of the non-hurricane catalog, it was replaced by the simulated hurricane precipitation. This blending process is done smoothly so that there is no jump between the hurricane precipitation and the ambient precipitation. The final product is one unified view of the precipitation hazard, as you would observe in nature.
Managing Your U.S. Flood Risk with a Comprehensive and Unified View of Precipitation from All Sources
Considering the frequency and severity of precipitation-induced floods and the losses they can cause, managing just part of your flood risk is not optimal—nor is it necessary. High-resolution, physically based catastrophe models that simulate both tropical and non-tropical precipitation realistically can allow insurers to expand into new markets profitably and cover the flood insurance gap. Through the innovative methodologies and machine learning used in their development, the updated AIR Hurricane Model for the United States and the updated AIR Inland Flood Model for the United States together offer the industry a unified and comprehensive view of flood risk from all precipitation events never before available to the industry to help you enhance your risk management and resilience strategies and truly own your U.S. flood risk.
References
Skamarock, W.C. (2005), A description of the Advanced Research WRF Version 3. National Center for Atmospheric Research.
Dee, D.P. (2011). The ERA-Interim reanalysis: configuration and performance of the data assimilation system. Q. J. of Royal Meteorological Soc., 137, 553-5597.
Landsea, C. W. and J. L. Franklin, 2013: Atlantic Hurricane Database Uncertainty and Presentation of a New Database Format. Mon. Wea. Rev., 141, 3576-3592.
Berner, J, Shutts F, et al., (2009) A spectral stochastic kinetic energy backscatter scheme and its impact on flow-dependent predictability in the ECMWF ensemble prediction system. Journal of Atmospheric Science. 66: 603-626.
PRISM Climate Group, Oregon State University, Feb 2004.
