
Managing the Changing Mortality Risk in an Aging U.S. Population
May 21, 2019
Editor's Note: Earlier this year, AIR released its first longevity model—a component of the AIR Life Solutions suite—which uses statistical techniques to help users quantify and project mortality trends and variability over time. This article discusses the changing mortality rates for various age groups of the U.S. population, with a focus on those 65 and older, and how AIR’s longevity model stochastically captures and quantifies these changes to empower strategic risk decisions.
The United States population is aging—it is expected that in the next 40 years, more than 20% of the population will be 65 or older. Since 1900, U.S. life expectancy has increased overall, thanks to medical advancements that include vaccines, antimicrobials, and medical devices and procedures, with significant increases for those born after World War II. These advancements have changed the leading causes of death: while mortality risk from cancer and cardiovascular diseases has been lowered overall, living longer increases the chance of dying from dementia-related diseases.1 Furthermore, even when conditioning for age, the leading causes of death have changed. Individual factors, such as education and treatment, also play an important role in disease risk.
As mortality trends shift, historical actuarial methods must shift as well. Life insurers, enterprise risk managers, and reinsurers—whose mortality estimations are integral to sound financial planning and business decisions—require a more in-depth understanding of the underlying causes of mortality and the changing dynamics of living longer to better estimate and manage future mortality risk. AIR’s longevity model captures the magnitude of and uncertainty in future mortality changes, allowing you to understand what is driving losses for various population groups. Understanding longevity changes over time will lead to better financial risk management practices. In the following sections, this article discusses changes in mortality risk over time and the underlying reasons for these changes.
Mortality Trends and Leading Causes of Death Across Age Groups in the U.S.
The leading causes of death are not the same across age groups in the U.S. For the population between the ages of 20 and 40, injuries—including drug overdose and suicide—are the leading causes of death; for those between the ages of 41 and 65, cardiovascular diseases and cancers lead.
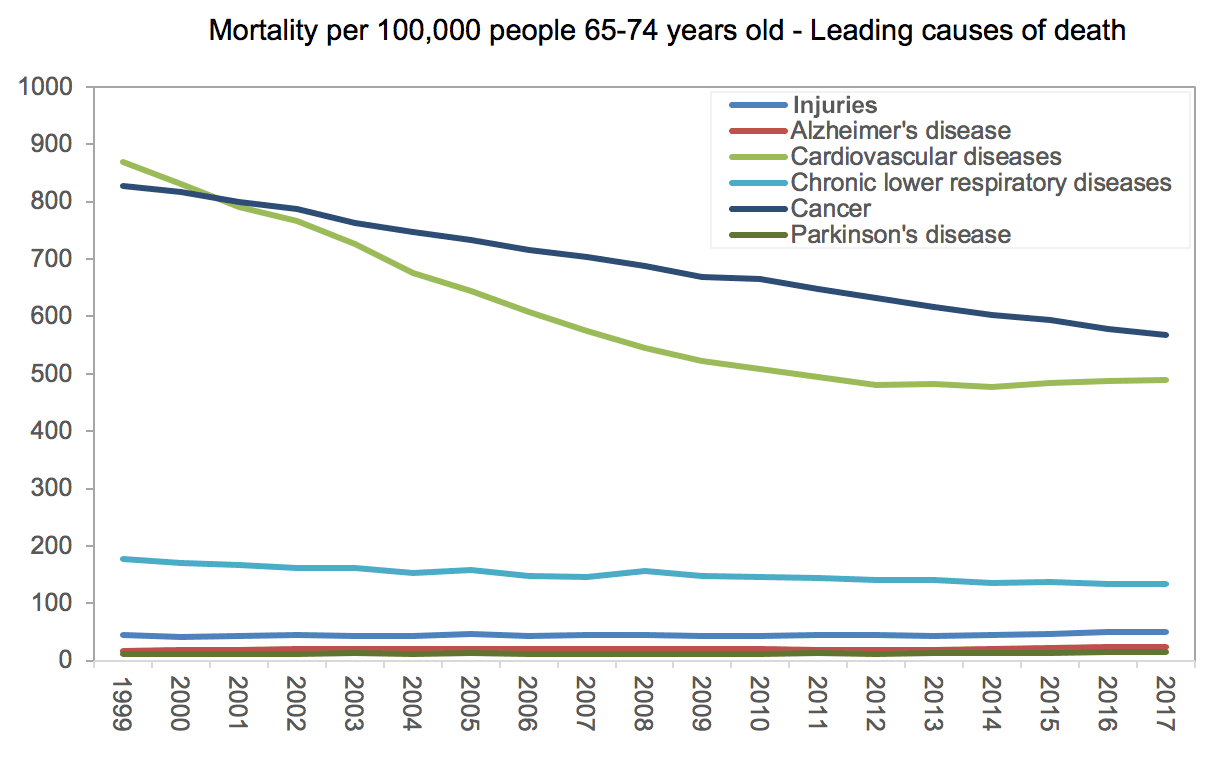
Until 2001, cardiovascular diseases (CVD) were the leading cause of death for people ages 65 to 74. Since then, due to medical advancements that allow people to control their cardiovascular conditions, CVD has dropped to second place, superseded by cancer. Since 2010, however, there has been a slowdown in the rate of CVD mortality improvements, while cancer’s mortality rate continues to decline at the same historical rate. (Figure 1).
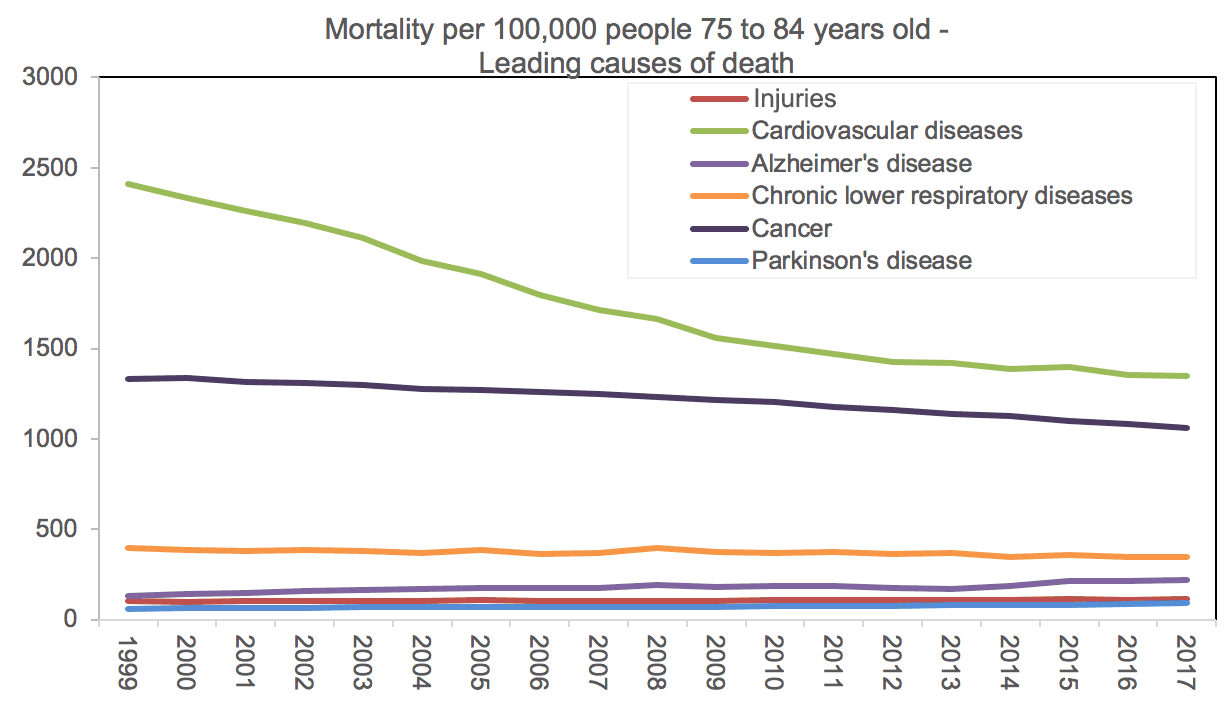
Despite the similar slowdown in mortality improvement among people who are 75 to 84 years old, cardiovascular diseases have been the leading cause of death since 1999, followed by cancer (Figure 2).
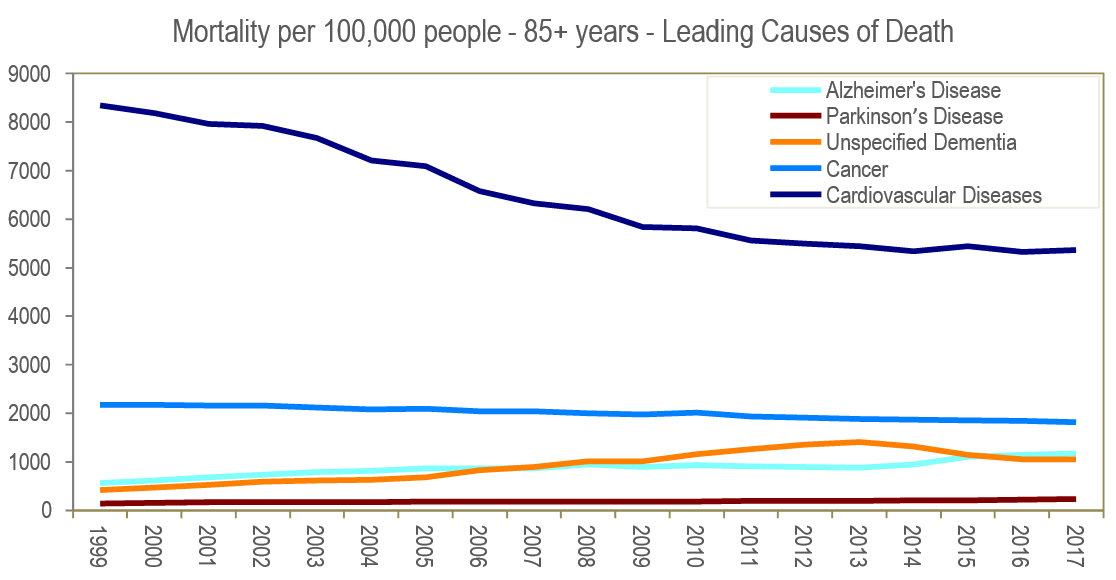
For people 85 and older, cardiovascular diseases remain the leading cause of death (Figure 3)—again, with a slowing of the mortality improvement since 2010. What distinguishes this age group’s mortality risk from other groups’ is the increase in dementia-related mortality, which is dominated by two diseases: Alzheimer’s and Parkinson’s. Figure 3 also shows unspecified dementia categorized separately to highlight the increasing mortality rate.
Dementia: A Rising Cause of Death in the 65 and Older U.S. Population
Dementia is characterized by memory loss and cognitive decline; Alzheimer’s disease is the most common form, with symptoms that start to manifest with memory loss, which leads to increasingly negative impacts on daily activities and problem-solving. As the disease progresses, the connections in the brain begin to break down. This in turn hinders the brain’s capacity to control functions such as language and reasoning, with loss of movement control in later stages. In the United States, 11% of people 65 or older and 32% of people 85 or older have Alzheimer’s. Another common form of dementia is Parkinson's disease, a progressive nervous system disorder that affects movement. Symptoms start gradually, sometimes with a barely noticeable tremor in just one hand. The disorder also commonly causes stiffness or slowing of movement. Alzheimer’s, Parkinson’s, and other associated nervous system diseases have increased mortality risks; they are both associated with an increased risk of pneumonia and injury from falls, for example.
Individuals who might have died of a cardiovascular disease or cancer in years past are now living long enough to be at greater risk for dementia; this is reflected in rising dementia mortality rates in those 85 and older (Figure 4).
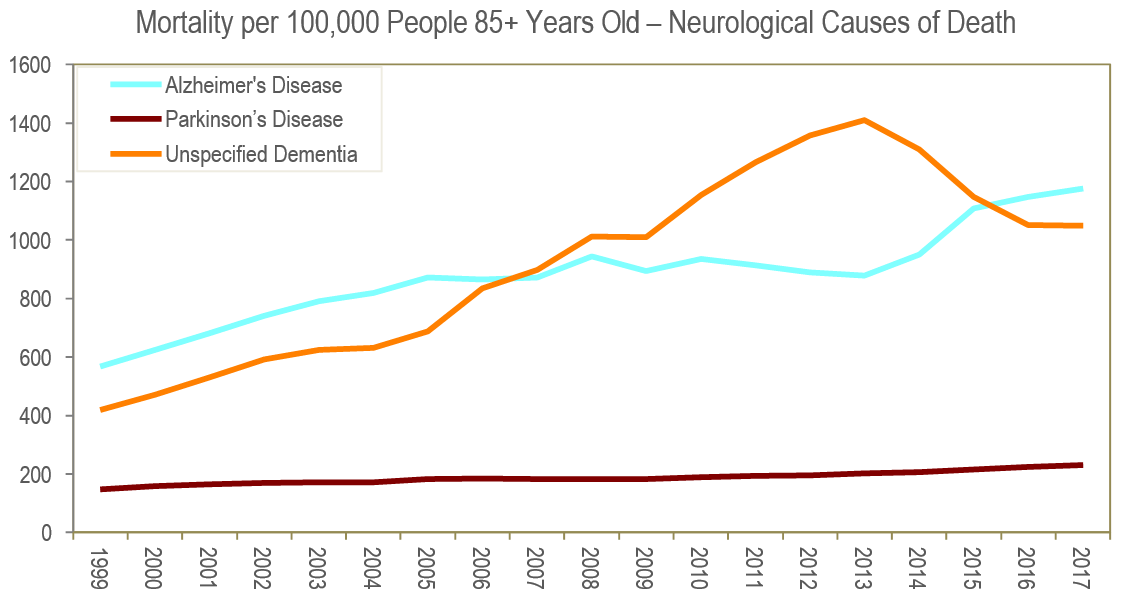
According to the CDC, improved diagnosis rates, better dementia prognosis, and better treatment of other diseases are among the reasons that the Alzheimer’s mortality rate reflects an increase at the same time that the older population is growing. Improved cause-of-death determination is also a factor: Compared with 20 years ago, the CDC states there is now a higher chance that the code for cause of death of someone exhibiting Alzheimer’s symptoms will be correctly recorded as Alzheimer’s, even if the death was from a related cause such as a fall or pneumonia. These changes in the reporting system can be seen in both rising overall cause-of-death recording for dementia since 2001 and increased specificity of diagnoses following 2011.
There are individual risk factors that may impact susceptibility to diseases of the nervous system. For example, brain development from a higher level of education has a protective effect against Alzheimer’s disease, as does access to more aggressive treatments for cardiovascular diseases and diabetes.
In general, as the population ages and mortality due to other chronic conditions continues to decline, a larger proportion survives to an age where there is a high risk for dementia. Studies estimate that in 40 years 23% of the U.S. population will be 65 or older, resulting in more than 10 million cases of dementia, Parkinson’s, and Alzheimer’s.
Cancer, Cardiovascular Diseases, and Impacts of Obesity
While cardiovascular diseases and cancer are the leading causes of death in the United States, particularly among people ages 65 and older, mortality from these diseases has been declining. The CVD mortality rate started declining in the 1960s, while cancer mortality started to decline during the 1990s. The decline in the cancer mortality rate can be attributed mainly to more frequent screenings, earlier diagnoses, availability of better treatments, and reduction in risk factors such as smoking. Despite this, the overall number of people who are diagnosed with cancer is increasing mostly due to population growth and the aging of the U.S. population.
While the overall number of deaths due to cardiovascular diseases has historically increased—again due to population growth and aging—the actual mortality improvement rate had been rising steadily until 2010, when it began to slow. This slowdown in CVD improvement started about three decades after the onset of the obesity and diabetes epidemic (Figure 5). Cardiovascular diseases are is among the most frequent causes of mortality for people who have been diagnosed with diabetes and/or who are obese. It is believed that the observed lag between the spike in diagnosed diabetes and obesity and the decline in cardiovascular improvement can be attributed to the chronic nature of these conditions that develop over time.
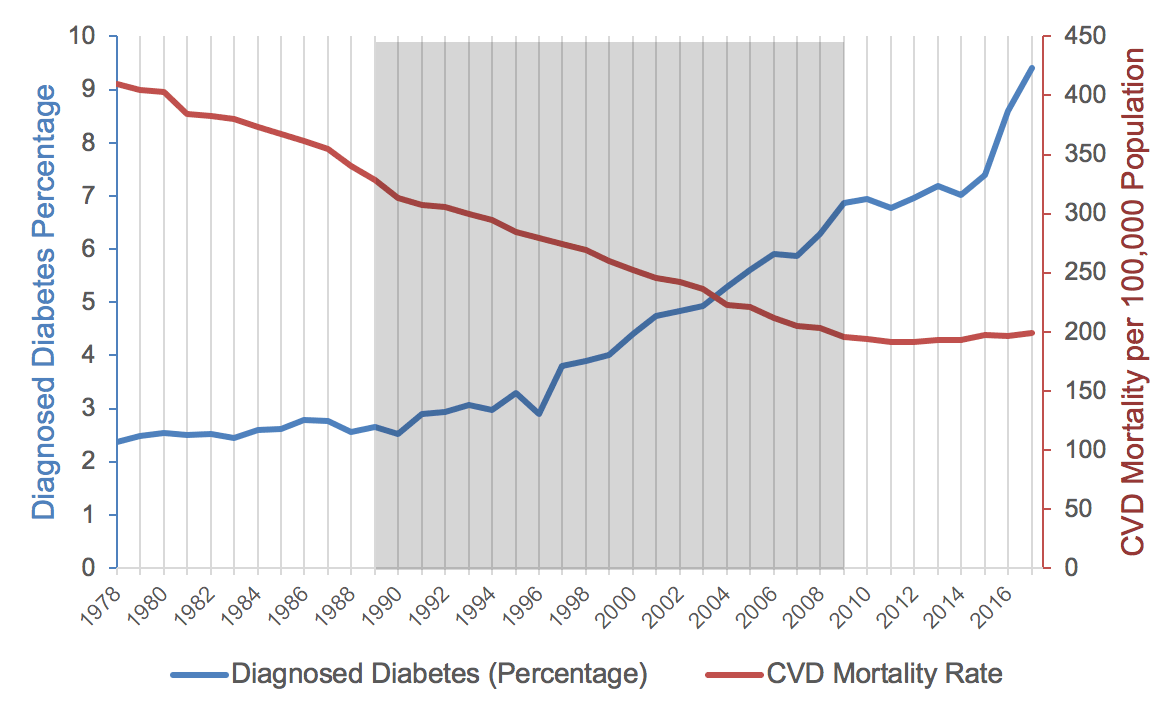
While the CDC projects that cancer will soon become the leading cause of death in the United States, some concerns have been raised from the scientific community that we may see cardiovascular diseases as the leading cause of death for a longer time, particularly among those 65 and older.
Rural Settings and the Mortality Rate in the 65 and Older Population
Studies show that people who live in rural areas2—about 15% of the U.S. population—have higher mortality rates. This population also experiences a higher proportion of preventable deaths. Residents of rural areas in the United States tend to be older and have a higher rate of smoking, higher blood pressure, higher obesity rates, lower physical activity, lower use of seat belts, and reduced access to healthcare. Urbanicity—living in larger metropolitan centers—has a direct correlation with a low mortality rate according to observed data and for the aforementioned reasons. For example, among those 65 years and older in 2017, mortality was 20% lower in large metro areas3 than in rural areas. The mortality gap between metropolitan and rural areas is mostly stable, with better mortality improvement in urban settings, although this improvement has slowed down in the last couple of years.
Managing Mortality Risk
More than any other industry, the life insurance industry faces issues associated with the world’s rapidly aging population. As the different diseases and risk factors that affect older generations change, it is incumbent upon insurers to gain a deeper understanding of their risks. At the same time, former methods of uncovering insight into an insured’s mortality risk are less reliable, as family history does not carry as much weight as it once did, and regulations increasingly limit access to detailed individual health data.
With people living longer than ever before, it is crucial for insurance companies to calculate longevity as accurately as possible. Rising life expectancy can be good news for insurers, as costs to insure against premature deaths have dropped; however, as pensioners and annuitants live longer, the price of guarantees made in earlier years could lower profit margins. Given that trends in mortality change dynamically and even differ within age cohorts, making calculations based on static actuarial tables—which employ historical trends that don’t account for current leading causes of death—and basing risk assessments on broad population mortality trends that miss individual risk factors, will exacerbate aggregate risk.
AIR Life Solutions were designed to help companies consider complex and dynamic mortality risk factors at the individual level, stochastically modeling causes of death and providing robust analytics to help inform business decisions. An in-depth understanding of what is driving losses at various risk levels can lead to better financial planning, enhanced risk selection in underwriting, strengthened portfolio management, and improved hedging strategies.
1The sources of data for mortality for each age group and cause are based on the Center for Disease Control and Prevention (CDC) Wonder database from 1999 to 2017. The underlying cause of death was assigned according to the International Classification of Disease (ICD) in use at time of death, revision 10 (ICD-10).
2 Counties in CDC metropolitan statistical areas (MSAs) that have a population of 50,000 or less.
3 Counties in MSAs with a population of 1 million or more. Calculations are based on mortality per 100,000 population among those 65 years and older from 1999 to 2017 in different levels of rural and urban settings in the United States. The urban vs. rural areas are based on National Center for Health Statistics (NCHS) Urban-Rural Classification in 2013. Source: Centers for Disease Control and Prevention, National Center for Health Statistics. Underlying Cause of Death 1999-2017 on CDC WONDER Online Database released December 2018. Data are from the Multiple Cause of Death Files, 1999-2017, as compiled from data provided by the 57 vital statistics jurisdictions through the Vital Statistics Cooperative Program.
References
Prince, M., Ali, G.-C., Guerchet, M., Prina, A. M., Albanese, E., & Wu, Y.-T. (2016). Recent global trends in the prevalence and incidence of dementia, and survival with dementia. Alzheimer’s Research & Therapy, 8(1), 23.
Weir, H. K. (2016). Heart Disease and Cancer Deaths — Trends and Projections in the United States, 1969–2020. Preventing Chronic Disease, 13.
Taylor, C. A., Greenlund, S. F., McGuire, L. C., Lu, H., & Croft, J. B. (2017). Deaths from Alzheimer’s Disease — United States, 1999–2014. MMWR. Morbidity and Mortality Weekly Report, 66(20), 521–526.
Kramarow EA, Tejada-Vera B. (2019). Dementia mortality in the United States, 2000–2017. National Vital Statistics Reports; vol 68 no 2. Hyattsville, MD: National Center for Health Statistics.
Products - Health E Stats - Overweight, Obesity, and Extreme Obesity Among Adults 2009-2010.
Preston, S. H., Vierboom, Y. C., & Stokes, A. (2018). The role of obesity in exceptionally slow US mortality improvement. Proceedings of the National Academy of Sciences, 115(5), 957–961.
CDC Press Releases. (2016, January 1). Rural Americans at higher risk of death from five leading causes
Singh, G. K., & Siahpush, M. (2014). Widening Rural–Urban Disparities in All-Cause Mortality and Mortality from Major Causes of Death in the USA, 1969–2009. Journal of Urban Health: Bulletin of the New York Academy of Medicine, 91(2), 272–292.
CDC - Urban Rural Classification Scheme for Counties. (2019, February 28).
 Narges Dorratoltaj, Ph.D., MPH