


Pioneering Inland Flood Modeling in Japan
May 16, 2017
Editor's Note: The new AIR Inland Flood Model for Japan captures the inland flood risk posed by precipitation not associated with tropical cyclones. This article provides an overview of some of the innovative methodologies developed and employed by AIR to deliver a scientifically robust model and comprehensive view of the risk.
Approximately half of the population of Japan and about 75% of total insurable assets are on a floodplain. Because roughly 80% of Japan is mountainous, the utilization of floodplains for development is inevitable. Urbanization can exacerbate both on- and off-floodplain risk in an already flood-prone region as previously permeable surfaces are paved over and built upon, and naturally occurring flood defenses (such as marshes) are filled in.
While the flood risk posed by tropical cyclones is captured by typhoon models, tropical cyclones do not account for all flooding in Japan. In fact, only about 60% of flood losses can be attributed to precipitation associated with tropical cyclones in Japan, according to claims data; the other 40% of flood losses are from non-tropical systems, a non-modeled risk—until now. The new AIR Inland Flood Model for Japan, anticipated for release this fall, captures the flood risk posed by these atmospheric systems.
Historic Inland Flooding: The Need for Innovation
Over the course of two days in September 2000, a front passing over Tokai brought a total of 567 mm of rainfall at a maximum hourly rate of 93 mm to that city, as recorded by the Nagoya Meteorological Observatory. The heavy precipitation over such a short time period caused widespread inundation and brought river levels to, or beyond, capacity, eventually resulting in the collapse of the bank of the Shinkawa River and the breach of the Shonai River levee. Reports indicate that about 580,000 people were displaced, and more than 63,000 houses were damaged.1 Insured losses of USD 990 million were reported.2
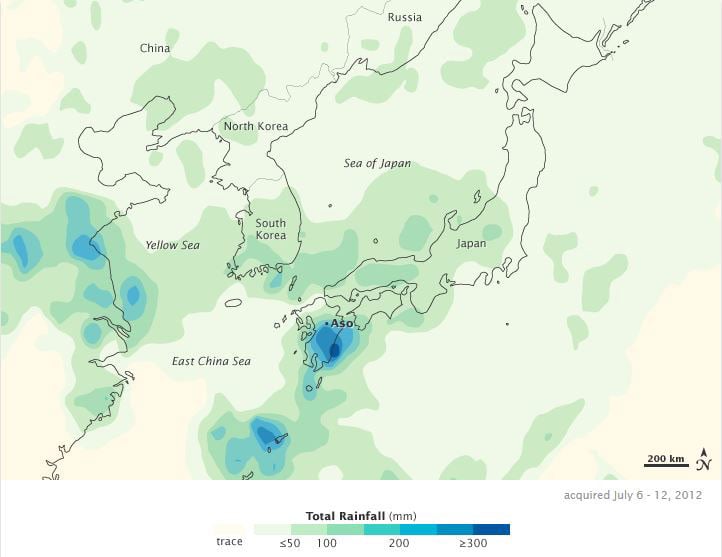
Twelve years later, almost a week of torrential rain (again, not associated with tropical cyclone activity) fell on the Japanese island of Kyushu—in July 2012—bringing more than 300 mm of precipitation to many locations and more than 500 mm to the town of Aso (Figure 1).3 A rainfall rate of 101 mm per hour was recorded in Kagoshima, a coastal city on the southern part of Kyushu. Approximately 50,000 people were ordered to evacuate, 20 people were killed, and floodwaters damaged houses and cars; landslides caused by excessive precipitation also reportedly destroyed or buried houses.4 Insured losses were reported as USD 1.4 billion for this event.5
To help companies better prepare for the impacts of severe events such as the Tokai and Kyushu floods, but also for the several damaging floods that occur every year, AIR developed an innovative new Japan inland flood model, anticipated for release this fall.
A New Approach to Inland Flood Modeling
To capture a truly robust view of flood risk in Japan, AIR developed a unified hazard catalog—one that captures the gamut of atmospheric systems, both tropical and non-tropical. The four-step framework employed is illustrated in Figure 2.
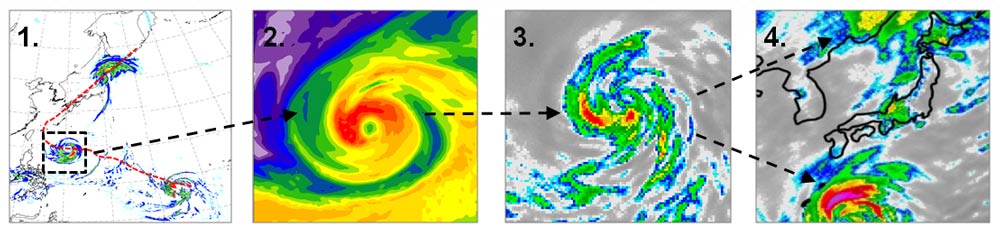
First, Numerical Weather Prediction (NWP) data are dynamically downscaled to realistically simulate rainfall patterns of historical non-tropical storms and tropical cyclones at a finer resolution (Figure 2, Box 1), the same methodology used in AIR’s other flood models. Because precipitation is not continuous in space and time, a continuous field—known as pseudo-precipitation—better suited for statistical modeling and that represents a spectrum of atmospheric moisture (i.e., humidity) is created (Figure 2, Box 2). Statistical perturbation is applied to these continuous fields to create stochastic simulations of precipitation from both tropical and non-tropical sources (Figure 2, Box, 3). The tropical and non-tropical precipitation are blended to create the unified view of the hazard that realistically captures rainfall patterns and intensities over space and time (Figure 2, Box 4).
Finally, the hazard catalog is separated—with tropical cyclone–induced flood events spun off to AIR's Japan typhoon model. Used in tandem, the inland flood and typhoon models provide companies with a complete view of flood risk. The focus of this article, however, is on the new non-tropical inland flood model and its (sub-model) components.
Hydrology Model Calibration
The hydrology model simulates the initial atmospheric conditions and the flow of the region’s rivers, given the precipitation, soil (and its antecedent moisture), and topological characteristics of the region. The calibration of the hydrology model—to ensure good agreement between measured historical and modeled river flows—for about 17,500 catchments (or smaller drainage areas) was based on data from approximately 1,000 streamflow gauge stations. For this, AIR employed a new calibration approach in collaboration with the University of California, Irvine, which used the Markov Chain Monte Carlo (MCMC) method in the DREAM6 model, a Bayesian framework which iteratively updates the model parameters based on its likelihood to produce flows closer to the observed flows.
The significant impact reservoirs and dams can have on water flow also needs to be taken into account in the hydrology model. Accordingly, approximately 1,100 reservoirs and dams throughout Japan have been modeled based on information from the GRanD database;7 the Japan Ministry of Land, Infrastructure, Transport, and Tourism (MLIT); and the International Commission on Large Dams (ICOLD). The operational rules of each reservoir or dam—which describe when and how river flows are regulated—vary by region, season, and the purpose of the reservoir. In the Japan inland flood model, reservoirs and dams were modeled based on historical observations of flow attenuation and the physical parameters of the mitigation mechanism (such as a reservoir’s location, purpose, and capacity).
Two-Dimensional Hydraulics Model
Once the hydrology model captures river flows and catchment precipitation, the hydraulics model can simulate flood extent. The Japan inland flood model consists of two components: pluvial (off-floodplain) and fluvial (on-floodplain). Two-dimensional modeling methodologies have been employed for the first time to provide more realistic views of the risk.
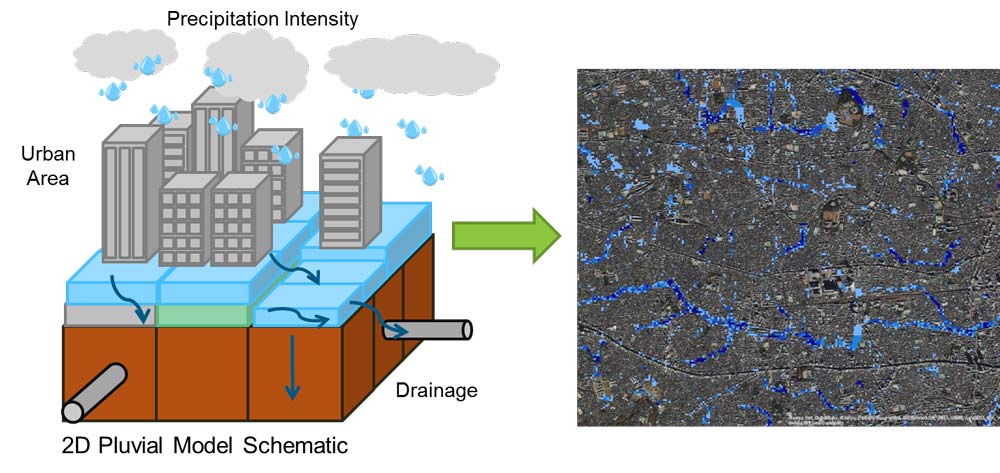
The new pluvial model explicitly and physically models off-floodplain risk. It is based on shallow water wave equations—a set of equations that describe the flow of shallow water—that are suitable for urban flood hazard modeling. For each grid cell in the model domain over the course of a precipitation event, these equations solve for the mass and momentum balances, including the water exchange between grid cells and any loss of water due to infiltration and drainage (Figure 3).
 Marc Marcella, Ph.D.
Manager, Senior Scientist
 Ruilong Li, Ph.D.
Manager, Senior Engineer
Edited by Rachel Wisch, CCM
The article:
- The new AIR Inland Flood Model for Japan provides risk management tools for the 40% of flood losses in Japan attributed to precipitation from non-tropical systems.
- Innovative methodologies provide a unified view of rainfall from both tropical cyclones and non-tropical systems necessary to accurately model the precipitation hazard.
- A new and improved approach to hydrology model calibration with academic collaboration incorporates reservoir and dam data from across Japan for enhanced modeling of water flows.
- Novel two-dimensional hydraulics modeling physically and explicitly simulates on- and off-floodplain flooding, and incorporates storm drainage capacity and levee failure that occurs on only one side of a river.
Storm drainage capacity in urban areas can vary greatly by region. To explicitly account for storm drainage, AIR researchers collected data on drainage systems in urban/populated regions, which were combined with information on the return periods the systems were designed for and their maintenance ratio (i.e., the total maintenance-manpower necessary for the upkeep of a system). The information was used to develop the storm drainage capacity component of the new pluvial model.
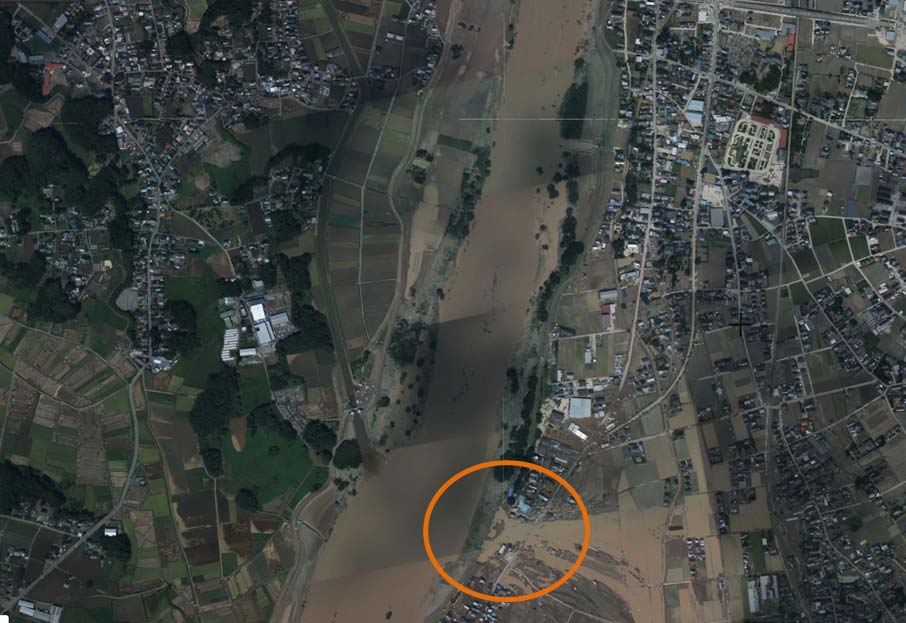
Two-dimensional modeling has also been explicitly applied across the floodplain in the new fluvial model for selected regions on 10 major rivers of Japan to provide a more robust view of the risk under more complex conditions. The model also accounts for the failure of a levee on only one side of a river, which is often the mode of failure when the river flow rate is at about or below design capacity of the flood defense (Figure 4).
Own Your Japan Inland Flood Risk
Considering the frequency and severity of precipitation-induced floods and losses they can cause, managing just 60% of your flood risk is not optimal—nor is it necessary. The innovative methodologies and academic collaboration used in the development of the Japan inland flood model are pioneering advancements in risk modeling to ensure the most robust model results possible based on the latest scientific research available. The new AIR Inland Flood Model for Japan provides a comprehensive view of inland flood risk never before available to the industry to help you enhance your risk management and resilience strategies and truly own your Japan flood risk.
References
1 The Associated Programme on Flood Management Integrated Flood Management Case Study: Japan: Tokai Heavy Rain (September 2000)
2 Insured loss estimates from Swiss Re sigma.
3 NASA Earth Observatory: Heavy Rains in Kyushu, Japan
4 Unprecedented rainfall causes floods and landslides in Kyushu, southern Japan
5 Insured loss estimates from Swiss Re sigma.
6 Approximate Bayesian Computation using Markov Chain Monte Carlo Simulation: DREAM
7 The Global Reservoir and Dam Database
