


Icy Winters in Canada’s Past and Future
Jan 27, 2016
Editor's Note: The risk of building, content, and time element losses from freezing rain is ever present, especially with increasing concentrations of property value in at-risk regions of southern Ontario, Quebec, and eastern Canada. In this article, we consider the potential for damage from freezing rain, or ice storms, with a look back at the Great North American Ice Storm of 1998.
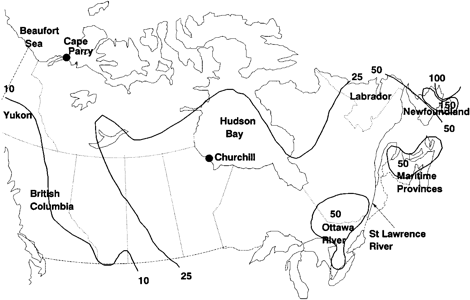
Freezing rain—the most costly sub-peril of winter storms in Canada and a major hazard in all parts of the country—is especially damaging from Ontario to Newfoundland. Historically, the Saint Lawrence and Ottawa river valleys and eastern Canada, the most densely populated and heavily industrialized regions in the country, have experienced the most hours of freezing precipitation, as shown in Figure 1.1
Since 1900, several particularly damaging ice storms have affected Ontario, Quebec, and neighboring regions. (See Table 1.)
| Date | Affected Areas | Freezing Rain (maximum) | Other Impacts |
|---|---|---|---|
| November 22-23, 1909 | Lake Huron to Ottawa River, Ontario | 65-75 mm | |
| December 27-30, 1942 | St. Lawrence River Valley | 57 mm | 38 cm of snow, 65 km/h wind |
| February 23-26, 1961 | Montreal | 25-35 mm | 80 km/h wind, gusts of 115 km/h |
| January 13-15, 1968 | Southern Ontario | 60-65 mm | 35 cm of snow |
| December 12-14, 1983 | Southwestern Quebec | 30-50 mm | 15-25 km/h wind, gusts of 25-45 km/h |
| December 24, 1986 | Eastern Ontario and southwestern Quebec | 30 mm | Freezing rain occurred over 14 hours |
| January 4-10, 1998 | St. Lawrence and Ottawa river valleys to the Maritime Provinces | 100 mm | 30,000 wooden utility poles and 1,000 transmission towers damaged |
| February 2, 2003 | Wolfe Lake and Moncton, New Brunswick | 40-60 mm | 75 km/h wind |
| December 20-22, 2013 | Southern Toronto and Ontario and the Maritime Provinces | 30 mm | 20-50 mm of snow and widespread power outages |
 Dr. Bria Kordi
Senior Engineer
Edited by Dan Edson
The article:
- Freezing rain in Canada can result in high insured losses, especially in the region from Ontario to Newfoundland.
- The Great North American Ice Storm of 1998 deposited nearly 100 mm of freezing rain, devastating the electrical power grid.
- AIR developed an Ice Accumulation Index for quantifying ice storm severity in Canada.
- Generally ice storms produce greater accumulation of winter precipitation than snowstorms.
The most recent major event, the 2013 Toronto Ice Storm, deposited 30 mm of freezing rain onto the city, causing major damage to trees and power lines. Widespread power outages from the storm left more than 1 million people without electricity for nearly three days, tens of thousands for more than a week. Insured losses for the event totaled about CAD 200 million.2,3
The January 1998 ice storm—discussed in the next section—stands as the most severe ice storm to hit Canada in recent memory due to the thick ice accumulation, the storm's multi-day duration and areal extent, and the population affected.
The Great North American Ice Storm of 1998
From January 4 through January 10, 1998, a devastating ice storm with high levels of precipitation moved across a broad, high-population area, from eastern Ontario to southwestern Quebec, southern New Brunswick, and Nova Scotia (as well as northern New York and parts of New England). The Great North American Ice Storm of 1998 dumped 73 mm of freezing rain on Kingston, 85 mm on Ottawa, and 100 mm on areas south of Montreal over the course of 80 hours, leaving a coating of ice on buildings, power lines, transmission towers, tree branches, vegetation, vehicles, and roads. The storm claimed 28 lives in Canada and 17 in the United States.
As the 1998 storm demonstrated, in addition to the risk of death and injury, ice storms can have a widespread impact on a regional economy from physical damage, as well as from power outages that darken homes and shutter businesses.
Damage, Power Outages, and Disruption
Southeastern Ontario and southern Quebec suffered the most damage and disruption from the 1998 ice storm, primarily from the weight of accumulated ice on trees and on power lines and their supporting structures. Millions of trees were damaged, with broken branches often falling on buildings, vehicles, and power lines, causing additional damage.
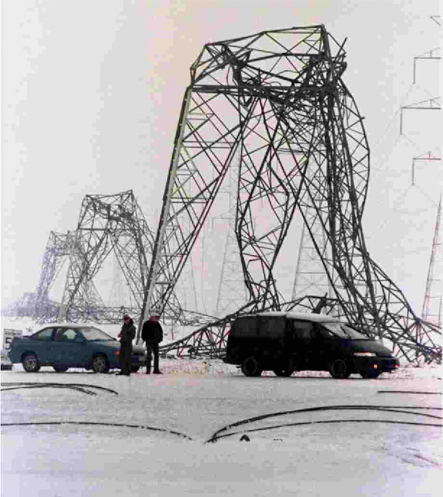
According to Statistics Canada, the heavy ice load brought down more than 30,000 wooden utility poles and toppled more than 1,000 transmission towers, of which 130 were major structures.4 (See Figure 2.) Approximately 90% of the 4.7 million people affected by the region-wide power outages lost electricity for more than a week, some for as long as a month.5
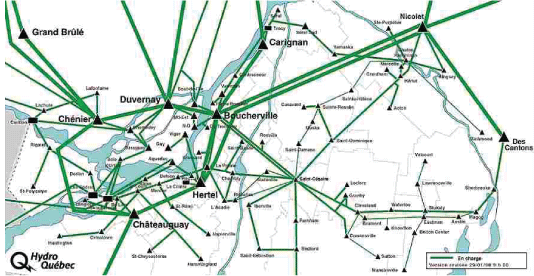
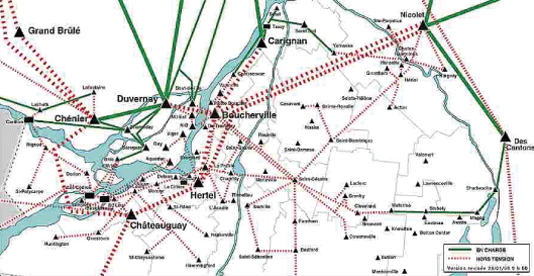
Significant service outages were experienced in Quebec, where more than 3,000 kilometers of the power distribution network were affected. (See Figure 3.) Major rebuilding of the power distribution network was required in the storm's aftermath.
In Montreal, power outages shut down much of the city's water supply system when pumping and filtration plants lost power, resulting in drinking water shortages for thousands of residents.
At the peak of the crisis, about 16,000 Canadian soldiers were deployed in the most severely affected areas, the largest peacetime deployment of Canadian troops ever. Icy roads—often blocked by fallen tree branches—slowed the pace of recovery.
Losses
The six-day Great North American Ice Storm of 1998 had a catastrophic impact on the Canadian economy, with an estimated CAD 4.5 billion in losses (1998 dollars).7
Insured losses totaled about CAD 1.6 billion in 1998 dollars, the largest insured loss in Canadian history.8, 9 More than 660,000 insurance claims were filed in Canada (a figure just short of the number of claims submitted after Hurricane Andrew devastated coastal Florida in 1992). Almost two thirds of the total loss was paid to residential coverages, 30% to commercial, and 10% to automobiles.
More than 2.6 million people (nearly 20% of Canada's labor force) were impeded or prevented from getting to work. The ice storm disrupted many agricultural and business communities for several days, generating huge losses for farmers (especially dairy farmers), the maple syrup industry, and timber companies.
Multiple Modes of Damage
As the 1998 storm demonstrated, freezing rain can cause significant losses through several mechanisms. While both freezing rain and snow produce loads that act on structures, freezing rain tends to adhere to surfaces and leads to ice buildup, which increases the load on structures as well as the surface area exposed to wind. Generally, more winter precipitation accumulates on structures from freezing rain events than snowstorms, increasing the potential for damage and loss.
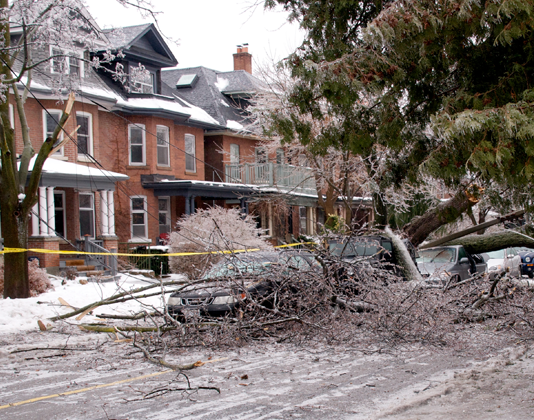
Accumulated ice also can cause greater damage to trees and power lines than snow. In general, 6 mm of radial ice thickness—typically produced by 12 mm of freezing rain—results in extensive damage to trees, such as limb and trunk breakage and uprooting. The impact of thick, heavy ice increases with high winds, which often accompany winter storms, enhancing the likelihood of damage. As shown in Figure 4, falling limbs and trees can also damage nearby structures and vehicles, as well as bring down power distribution lines.
In extreme events, ice-laden power transmission towers and other support structures can collapse in chain reactions, causing a cascading failure of transmission lines. The resulting power outages can trigger time element losses, including business interruption losses and additional living expenses, because otherwise functional offices buildings or residences might not be habitable for lack of heat or lighting. Outages also can lead to additional content losses due to food spoilage, and the risk of flooding due to burst pipes increases if the heating system operation is interrupted.
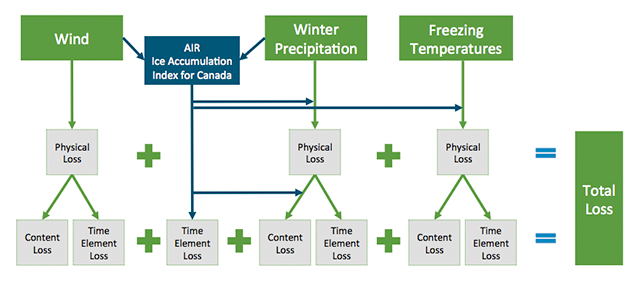
To explicitly model building, content, and time element losses resulting from freezing rain, AIR scientists developed an Ice Accumulation Index specifically for the Canadian environment. (See Figure 5.) The index, which is based on the Sperry-Piltz Ice Accumulation Index™,10 captures the impact of both ice accumulation and wind speed at a given location (since high wind speeds during ice storms can increase damage significantly due to wind loading).
Closing Thoughts
Freezing rain in Canada can be a relentless and costly peril. While the Great North American Ice Storm of 1998 was the most damaging freezing rain event in recent history, companies should prepare for the possibility of greater losses, even though improvements have since been made to the power systems. Furthermore, in any given year, similar loss levels from freezing rain might be reached through the aggregation of losses from multiple smaller events.
Effectively managing the risk of physical, content, and time element losses from freezing rain calls for a probabilistic model based on robust hazard data, a comprehensive view of vulnerability, and accurate exposure data.
References
Chainé, P. M., “Glaze and Its Misery: The Ice Storm of 22-23 March 1972 North of Montreal,” Weatherwise, 26, 124-127 (1973).
Jones, K. F., and N. D. Mulherin, “An Evaluation of the Severity of the January 1998 Ice Storm in Northern New England,” US Army Corps of Engineers (1998).
Klaassen, J., et. al., “Estimation of Severe Ice Storm Risks for South-Central Canada,” Government of Canada, Office of Critical Infrastructure Protection and Emergency Preparedness (2003).
Mahafey, F. J., “The Ice Storm of 25-26 February 1961 at Montreal,” Weatherwise, 14(6), 241-244 (1961).
Milton, J., and A. Bourque, “A Climatological Account of the January 1998 Ice Storm in Quebec,” Atmospheric Sciences and Environment Issues Division, Environment Canada, Quebec Region (1999).
Public Safety Canada (PSC), http://www.publicsafety.gc.ca/index-eng.aspx.
Endnotes
1 R. A. Stuart and G. A. Isaac, “Freezing Precipitation in Canada,” Atmospheric-Ocean, 37:1, 87-102 (1999).
2 PCS Canada
3 Insurance Bureau of Canada (IBC)
4 Statistics Canada, “The St. Lawrence River Valley 1998 Ice Storm: Maps and Facts.”
5 M. Kerry, et al., “Glazed Over: Canada Copes with the Ice Storm of 1998,” Environment, volume 41, issue 1 (1999).
6 Kerry, et al.
7 Public Safety Canada
8 IBC
9 PCS Canada
10 In the United States, the SPIA index, which considers both ice accretion on structures and accompanying wind speed, is used to estimate the number of outage days for municipalities during ice storms.
