


Global Pandemic Megadisaster—Are You Prepared?
Apr 22, 2016
Event: Catastrophic life and health losses due to infectious disease outbreak
Model: AIR Pandemic Model
Stochastic Event ID: 810254128
Affected area: Globe
Estimated insurable loss: USD 76.2 billion (global life insurance), USD 64.2 billion (U.S. health insurance)
Estimated mortality: 22,849,963
Annual loss exceedance probability: ~1% (100-year return period)
Event Overview
Large-scale infectious disease pandemics can cause millions of deaths and billions―or even trillions―of dollars in economic and insured losses. The possible frequency and scale of these perils are shifting as global connectivity grows, animal habitats alter, medical advancements continue, the population ages, and the climate changes. It is important to assess the potential risk to today's life and health portfolios.
This edition of Megadisaster features a global pandemic event caused by the influenza virus. During the month of November in a farming district of southern Russia near the Don River, rumors circulate about a peculiar illness causing severe outcomes in the young and the elderly. Over the next week, the illness spreads to Armenia via traveling farmhands, and then to the densely populated city of Moscow. Genetic analysis of one isolate from a fatal case reveals an infection by a novel subtype of influenza A virus, to which the majority of the human population has no existing immunity. Before the end of the year, an infected airline passenger travels from Moscow to Beijing, where the pathogen spreads through the local population at an alarming rate. Within a week, laboratories across the globe identify isolates of the same novel subtype of influenza A virus.

Six months after the start of the outbreak, a vaccine for this novel influenza virus is manufactured and distributed. By then, however, the pathogen is already present and spreading in most countries. Certain event characteristics are similar to those seen in historical outbreaks; transmissibility is similar to some estimates for the 1918 flu pandemic, while the ratio of fatalities to cases in certain countries is similar to the 1957 and 1968 flu pandemics. After 17 months―a relatively short period when compared with the observed influenza pandemic duration range of 1.5–2 years―the World Health Organization signals the end of the pandemic.
In the following sections, a brief history of pandemics is provided to give context to this scenario, followed by a description of affected exposures, estimated impacts and losses, and best practices for managing pandemic risk.
Pandemic History
The most devastating influenza pandemic in recorded history began in 1918 and was nicknamed the "Spanish flu." The particular pathogen that caused the event led to more deaths per case and had a higher rate of transmission than most other known strains of influenza virus. It also had the unusual tendency to cause mortality in a typically resilient demographic: people ranging in age from 20–50 years. Evidence suggests the event began in the United States, with the illness then spreading to Europe―possibly due to wartime troop movement―and the rest of the world.
Hundreds of millions of people were infected worldwide and up to 100 million lost their lives. In the United States alone, approximately 675,000 people (or about one in 200 residents at that time) died. Life insurance losses were estimated at nearly USD 100 million by The Insurance Press in 1919, corresponding to more than USD 20 billion1 today.
Since 1918, there have been three flu pandemics (1957, 1968, and 2009) and multiple outbreaks of international concern with varying magnitudes. The 2009 H1N1 flu pandemic was relatively small-scale when compared to previous flu pandemics. Despite this, retrospective studies suggest that as many as one in four people were infected by the circulating pathogen. In the U.S. alone, the Centers for Disease Control and Prevention estimates there were 61 million cases, 275,000 hospitalizations, and 12,500 deaths from the 2009 event.
Historical non-flu pandemics have also been significant. The 2002–2003 SARS "mini-pandemic" spread to 27 countries or regions, with 8,096 probable cases reported and 774 deaths. The more recent and larger Ebola outbreak that came to light in 2014 culminated with nearly 30,000 cases and 11,316 deaths reported.
In general, reported values from pandemic events are likely to underrepresent the true size of outbreaks for reasons such as variable reporting and diagnostic resources by location, and an inability to surveil untreated cases. Regardless of specific event size, each historical pandemic caused immense social and economic losses, and future events hold the potential to cause even greater damage as conditions evolve.
Affected Exposure
This Megadisaster scenario, with Event ID 810254128 in the stochastic catalog of the AIR Pandemic Model, kills nearly 23 million people and sickens more than 2.6 billion. In the early stages of the event, particularly in resource-limited regions, reporting agencies are overwhelmed by the magnitude of cases and deaths. Illness severity ranges from mild flu-like symptoms (i.e., fever, chills, malaise, cough, etc.) for which those infected may not seek treatment, to critical outcomes involving coinfections (such as pneumococcal pneumonia) that mandate hospitalization in an intensive care unit (ICU) or cause death.
This modeled event causes about 300,000 deaths, 4 million hospitalizations, and 40 million outpatient clinic appointments in the United States alone. Certain demographic characteristics influenced these outcomes, such as age. The relationship between age and health outcomes in the United States for this modeled pandemic event can be seen in Figure 2.
Middle age groups had the lowest rate of severe outcomes, while illness in a person aged 65 or older resulted in fatality more than three times as often as in those aged 0–14. Members of this youngest age group were taken to a clinician's office when experiencing flu symptoms at a higher rate when compared to all other age groups.
Estimating the Impact
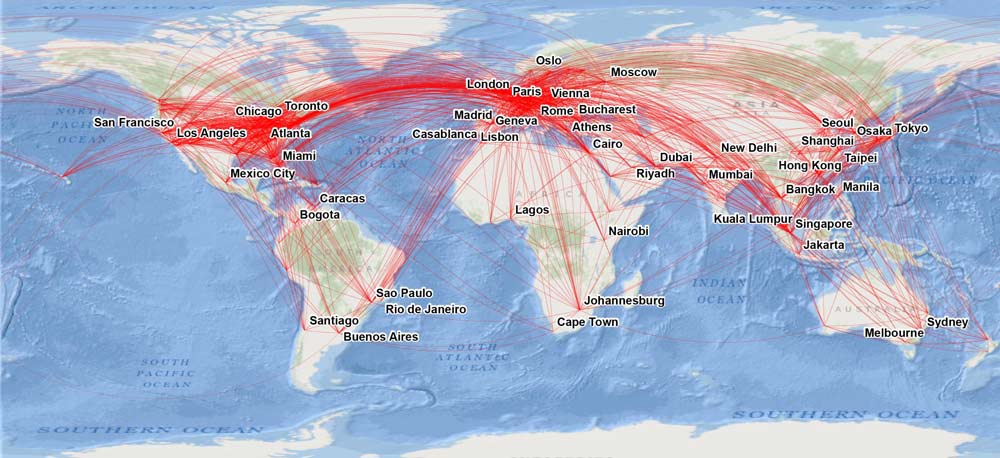
Where there are humans, there is the risk of an infectious disease outbreak. Events such as the 2002–2003 SARS outbreak and the 2009 H1N1 flu pandemic, in addition to our modeled pandemic Megadisaster, provide evidence of the impact of our interconnected global society on the spread of disease. Whereas it once took days to travel across the Atlantic Ocean, it now takes a few hours. That speed of travel translates into heightened risk of worldwide disease transmission, with less time to develop defenses to combat an outbreak.
Certain locations are considered to be more at risk of event occurrence than others. For example, where humans encroach upon previously uninhabited landscapes, or where warming temperatures alter the livable range of mosquitos and migration patterns of wild birds, transmissible pathogens may emerge. For this reason, the AIR Pandemic Model incorporates data on the density of animal species known to carry modeled pathogens. Other modeled factors that impact the regional risk of disease spread and severity include the age of the population, access to healthcare, national financial resources, and pharmaceutical stockpile size. These elements affect not only pandemic risk, but also the potential for financial loss.
Modeled losses from the Megadisaster scenario for seven countries are shown in Table 1.
| Country | Insurable Life Insurance Loss (USD Millions) | Deaths | Sick Persons |
|---|---|---|---|
| United States | 33,751 | 292,834 | 111,485,890 |
| Japan | 17,822 | 145,721 | 44,426,573 |
| United Kingdom | 9,003 | 58,123 | 21,415,119 |
| France | 6,096 | 55,767 | 20,202,238 |
| Germany | 4,673 | 23,925 | 1,778,441 |
| Canada | 3,801 | 31,075 | 12,038,505 |
| Australia | 1,034 | 20,871 | 8,236,295 |
Losses can extend to additional lines of business based on region and insurance penetration. For example, by including modeled losses for both life and health, the total loss estimate in the United States for the pandemic Megadisaster event increases from USD 33.8 billion to more than USD 98 billion. Losses for the 10 U.S. states most impacted by the modeled event are provided in Table 2.
| State | Health Insurable Loss* (USD Millions) | Life Insurable Loss (USD Millions) | Total (Health + Life) (USD Millions) |
|---|---|---|---|
| California | 9,428 | 3,654 | 13,082 |
| Texas | 4,799 | 2,282 | 7,081 |
| New York | 3,863 | 2,671 | 6,534 |
| Florida | 3,863 | 1,753 | 5,580 |
| Pennsylvania | 2,507 | 1,532 | 4,039 |
| Illinois | 2,444 | 1,466 | 3,910 |
| Ohio | 2,138 | 1,219 | 3,357 |
| New Jersey | 1,751 | 1,486 | 3,237 |
| Michigan | 1,885 | 1,032 | 2,917 |
| North Carolina | 1,855 | 1,046 | 2,901 |
| *Health insurable loss estimates include estimates of direct healthcare insurance claims from outpatient clinic visits, emergency room visits, hospitalizations, and prescription pharmaceuticals. | |||
Are You Prepared?
This Megadisaster causes a large amount of direct insurance loss for both the health and life lines of business due to excess morbidity and mortality. The larger economic impact would far exceed insurance losses as a result of behavior changes from fear of infection, leading to downturns in manufacturing, commerce, travel, and more. However, it is important to note that even at these high loss levels, this stochastic event still does not constitute a worst-case scenario. With an annual exceedance probability of 1%, or about a 100-year return period, there are pandemic scenarios that could cause far greater losses.
A comprehensive view of risk is necessary for responsible risk management and includes the assessment of a wide range of scenarios. Considering extreme pandemic events such as the Megadisaster described here can help you identify the strengths and weaknesses in your portfolio and better prepare for future catastrophes. Further opportunities for examination with greater levels of detail are provided by the AIR Pandemic Model, including explicit modeling of nine pathogens as of summer 2016.
Users of CATRADER®, AIR's aggregate modeling platform, can obtain a probabilistic view of potential losses to life and health portfolios, and input the breakdown of their portfolio by age and location (U.S. state or country) in order to assess risk. Being attentive to best practices for pandemic modeling can help ensure that you achieve the most realistic loss estimates:
- Utilize detailed exposure data and policy information. Characteristics such as location, age, and sex, can greatly impact potential loss estimates. Users can customize benefit levels in CATRADER to calculate losses to lines of business that include mortality or morbidity loss, such as death, health, personal accident, or workers’ compensation.
- Anticipate widespread enterprise risk management impacts. During a pandemic, businesses may see a simultaneous rise in insurance claims and depletion of workforce. Potential economic recession and a decline in assets could compound these workflow challenges. A comprehensive view of pandemic risk and workflow enhancements gained through AIR solutions can help you plan for and navigate such an event.
- Consider non-modeled sources of potential loss. Potential sources of insured loss from a pandemic not considered by the AIR model include coverage for travel/hospitality, liability, medical malpractice, event cancellation, and more.
Additional portfolio characteristics can inform more detailed loss calculations through the AIR consulting services, including member smoking status, prior health status, occupation, and sub-national location.
The AIR suite of resources includes a stochastic catalog of 500,000 simulated years with 1 million modeled events. Based on this stochastic catalog, AIR can estimate exceedance probabilities that vary by age, location, underwriting groups, and more for scientifically plausible infectious disease events to help you better prepare for the direct financial losses they may cause.
Closing Comments
The pandemic events described here—historical and stochastic alike—remind us how vulnerable humanity is to infectious diseases and highlight the challenges of preparation. The exact location and impact of the next pandemic is largely unpredictable and the human response is even more uncertain. Such a disease could be resistant to medical interventions, and hospitals and clinics may be incapable of accommodating the sick. Our interconnected world may spread the illness faster than we can create defenses for medical providers to even offer. While our increasing lifespans afford us more time with loved ones, the advanced age of our population may increase its susceptibility to disease. For these unknown potentials, probabilistic model results and analyses—including those of extreme scenarios like this Megadisaster—provide organizations with the robust view necessary for sound risk management.
Notes
1 AIR trends historical life insurance losses to modern-day dollars using the share of GDP method (the share of GDP represented by a historical loss value is calculated, and this proportion is applied to the current GDP).
