


Phase by Phase: Introducing a Detailed Approach for Evaluating Risk to Buildings under Construction
Jul 19, 2012
Editor's Note: Unlike completed buildings, the replacement cost and vulnerability of buildings under construction vary over time. In this article, AIR engineers Dr. Apoorv Dabral, Dr. Arash Nasseri and Puneet Bajpai provide an overview of the approach AIR has taken to capture the time-dependent nature of buildings under construction at different phases—an approach that has been implemented in AIR's U.S. hurricane and earthquake models.
No matter the state of the economy, structures—private and public, residential and commercial—continue to be assembled, albeit at faster or slower rates. In the year of the most recent survey of commercial buildings by the U.S. Energy Information Administration, more than 4,600 commercial structures were under construction1. For residential structures, that number is significantly higher in any given year; last year, over 440,000 single-family homes were built in the U.S2. This year (2012), 458,000 such residences are on track to be completed by year's end. In the first four months of 2012 alone, the total value of residential and non-residential construction work done on U.S. soil has exceeded USD 238 billion3.
From a catastrophe modeling viewpoint, a building under construction is unlike a completed building for two reasons. First, the exposure value, or replacement cost, of the building changes over time as different elements—such as foundation, exterior walls, or electrical finishes—are added. Second, as a result of adding these components, the vulnerability of these buildings to natural disasters also changes.
These complexities, in conjunction with the cyclic and costly nature of construction work, make it essential for companies whose portfolios include buildings under construction to critically evaluate their potential losses at different construction stages.
Four Phases to Completion
To assess the risk to buildings under construction, unique vulnerability curves must be created (to capture how buildings at different phases respond to different perils) and granular exposure values are necessary (to reflect the changes in replacement cost that occur as different building features are added).
To facilitate the process, AIR engineers divide the construction period into four phases: (I) foundation and substructure, (II) superstructure, (III) walls and roofing, and (IV) finishing, mechanical and electrical installation.
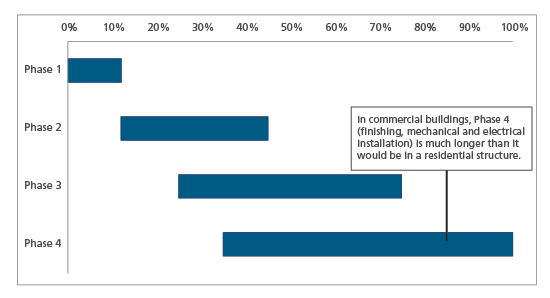
The time required to complete each phase, the phase duration, is dependent on the building type. For commercial buildings, for example, phase IV—in which the finishing work is done, and the electrical and mechanic components installed—is much longer than it would be for a residential structure, which will have many fewer and smaller rooms. Figure 2 shows an example of the phase timeline for a mid-rise commercial building (4-7 stories tall). Note that work in phases III and IV typically starts before the end of phase II. The overlap of phases—some of which are more susceptible to damage than others—is critical in the context of understanding phase vulnerability, as this article will go on to explain.
To determine phase duration for different building types, AIR engineers collected engineering cost estimation data, as well as input from construction management engineers.

By:
Dr. Apoorv Dabral,
Dr. Arash Nasseri,
and Puneet Bajpai
Edited by Meagan Phelan, CCM
The article: reviews the importance of extensive structural analyses when trying to determine potential damage and loss from natural catastrophes to buildings under construction.
Highlights: AIR's hurricane and earthquake models incorporate damage functions that take into account the time-dependent aspects (vulnerability and replacement value) of buildings under construction. The models accurately estimate the risk to buildings at each construction phase, from the foundation and substructure to finishing. Phase losses can inform construction timelines.
Variations in the Replacement Cost during Construction
Throughout a construction period, a building's replacement cost increases steadily until it reaches the value of the completed building. How much the replacement cost increases from phase to phase depends largely on the building's occupancy class and height. In apartment buildings, for example, cost is concentrated in phase IV; accordingly, the value at risk can be particularly high at this time. For other occupancy types, such as a wholesale trade centers, costs are usually concentrated in phases II and III due to the extensive walls, roofing, and other elements of the superstructure. Even within an occupancy type, the percentage of the total replacement cost a particular phase will represent differs based on building height. For apartment buildings, for example, the replacement cost at phase I is greater for high-rise apartment structures than it is for low- or mid-rise apartments; high-rise structures require more elaborate foundations.
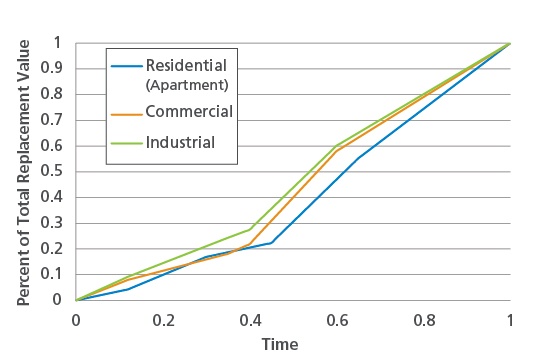
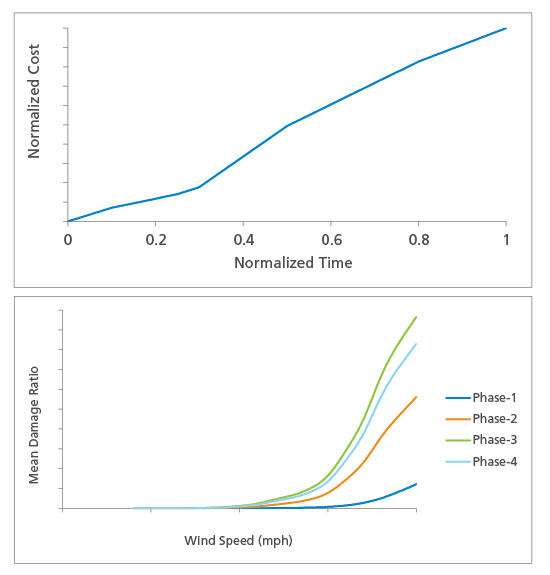
AIR engineers plot replacement cost percentages with phase duration to develop cost ramp-up curves. These curves capture the relationship between the building cost and construction time for buildings of different heights and occupancy classes. Figure 3, for example, shows ramp-up curves for low-rise buildings of three occupancy classes. Note that the curve ramps up more sharply for apartment buildings after phase IV than it does for commercial or industrial structures; apartments require a larger amount of interior work and finishing. Also, the materials used for apartment kitchens and bathrooms are of a higher quality than those in most commercial and industrial structures.
Variations in Vulnerability during Construction
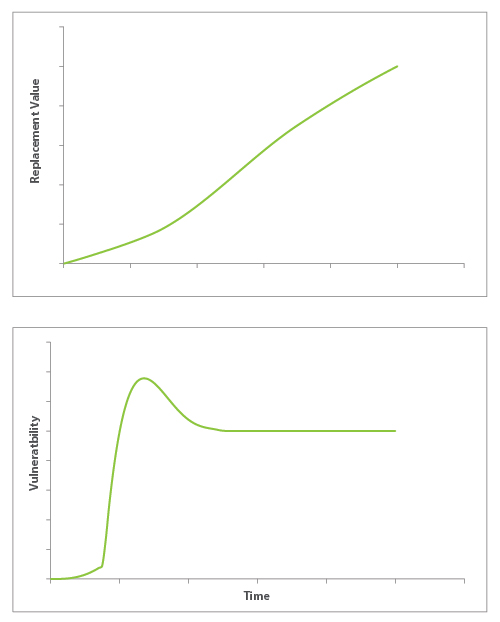
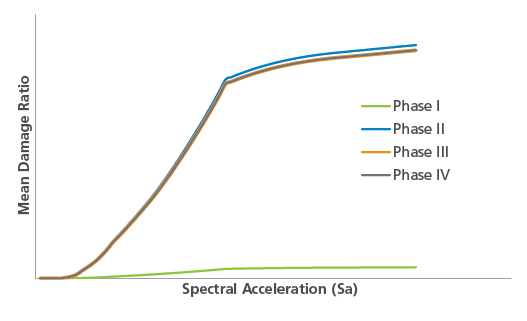
One of the most challenging aspects of estimating potential damage to buildings under construction is creating the vulnerability curves that accurately capture how buildings at different phases respond to different perils. At any given time, the loss depends on the replacement value and corresponding vulnerability (Figure 4).
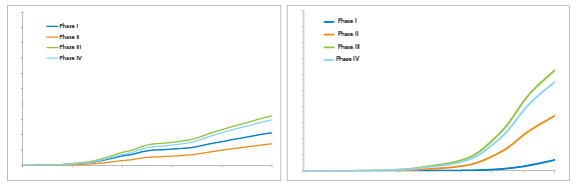
While changes in a building's replacement value are independent of the peril under consideration, changes in vulnerability are peril-specific. Note, in fact, that hurricanes can cause damage from two separate perils: wind and storm surge.
In general, the vulnerability of a building under construction to earthquake ground shaking increases dramatically once the foundation and substructure are complete, and then levels off after the addition of all elements of the lateral-load resisting system, during Phase II. During Phases III and IV, vulnerability is similar to that of a completed building. The vulnerability to hurricane wind increases and then levels off after openings—present during Phase III—are closed. (Closing these openings also prevents wind-driven water from penetrating the building and causing internal water damage to interior work.) Vulnerability to storm surge is highly dependent on construction type and building height. In a mid-rise engineered commercial building, for example, the vulnerability to storm surge is lower at Phase II than that it is at Phase I because storm surge waves at Phase II are pounding into a building skeleton rather than the more vulnerable, incomplete building foundation. Vulnerability to storm surge is highest during Phase III, when damage occurs to completed walls and building interiors, significant portions of which have been started by this phase in most mid-rise commercial buildings.
To develop earthquake- and hurricane-specific damage functions for buildings whose vulnerability vary over time, AIR engineers leveraged engineering studies, damage reports and significant previous experience capturing risk to buildings under construction (AIR supports the construction-all-risks/erection-all-risks line of business in earthquake models for China and Japan, and in tropical cyclone models for Japan, China, India, Taiwan, the Philippines, Hong Kong and South Korea). AIR engineers also conducted extensive structural analyses of different structures during each of the four phases.
Results are illustrated in Figure 5 and Figure 6, which show the differences between the vulnerability functions of various phases when time is fixed. Not surprisingly, foundations (Phase I) are not very vulnerable to earthquake shake (the intensity of which is measured in the AIR model by spectral acceleration). The vulnerability to ground motion of other phases is very similar. Note, too, the reversal in wind and storm surge vulnerability of phases I and II in Figure 6.
To develop the phase vulnerability functions, AIR engineers evaluated the various sub-components most pertinent to a building's vulnerability at each phase. When phases overlap (as in Figure 2) AIR engineers considered the damageability of all components in play to develop the vulnerability curve for a single phase.
Estimating a Variety of Loss Metrics in CLASIC/2
The builder's risk modeling capability in AIR's detailed modeling application CLASIC/2TM yields a rich variety of information. Once construction start and end dates are input into the software, users can choose to quantify:
- average loss (annualized project loss for the duration of the construction period)
- phase-specific losses for phases I through IV (to do this, users input project phase)
- worst-case loss (which can occur at any point during construction)
Average loss represents the overall builder's risk for the entire construction period. This value is most suited for underwriting builder's risk policies. It can also be used in conjunction with the percentage completion input, described below, to underwrite policies purchased after construction has started.
While the average loss option provides a good estimate of the average risk over the entire project, underwriters may prefer the ability to quantify losses by phase in some cases. For example, when considering hurricane risk to buildings under construction in Florida, an underwriter who has assessed phase losses can identify and evaluate potential losses at the building's most vulnerable phase. If losses exceed a certain value, the underwriter may work with the construction company to ensure that the most vulnerable phase will not coincide with the most active part of the hurricane season (August and September) or, if this is not possible, that the building progress in these months does not advance beyond the early stages of the most vulnerable phase; this puts fewer construction materials at risk.
Phase loss estimates are also useful to portfolio managers performing quarterly loss analyses in order to obtain detailed loss estimates for three-month periods. In such cases, the average loss could over- or underestimate loss.
Worst-case loss is used to estimate the maximum loss scenario at any point in time of the project. The worst-case scenario for the hurricane peril—for which vulnerability drives the risk—typically occurs during phases III or IV, when the building envelope is not complete or the value of the building is at its highest. By comparison, the worst-case scenario for earthquake—for which the replacement cost drives the risk—typically occurs at the end of phase IV, when the exposure values are highest.
Model users can also estimate losses to builder's risk policies that begin coverage after construction of a building has started. Users enter a percentage completion value to determine average losses to just the portion of the project covered by the policy.
Case Study: Modeling a Commercial Builder's Risk Project for Hurricane
In the following example, we look at best practices for accurately modeling a three-year builder's risk policy for hurricane winds using the example of a single risk: a high-rise commercial structure of reinforced concrete. It is not uncommon for a builders risk policy to span several years; the AIR model annualizes periods exceeding 365 days to one year. This allows for the seamless application of policy conditions.
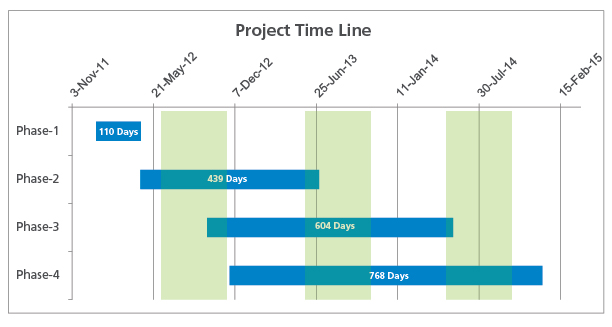
Figure 8 shows the building's cost ramp-up curve, as well as the building's time-dependent variation in vulnerability, both of which are affected by the building's primary characteristics: reinforced concrete construction, general commercial occupancy, and high-rise level height.
In this example, the period of construction encompasses three hurricane seasons. The model utilizes user-provided construction start and end dates to calculate losses only for phases that occur during the hurricane seasons.
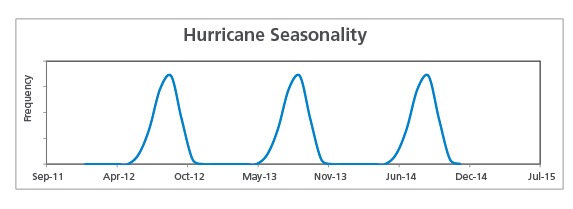
Figure 10 shows losses output by the model for various scenarios of potential wind damage over the three-year period.
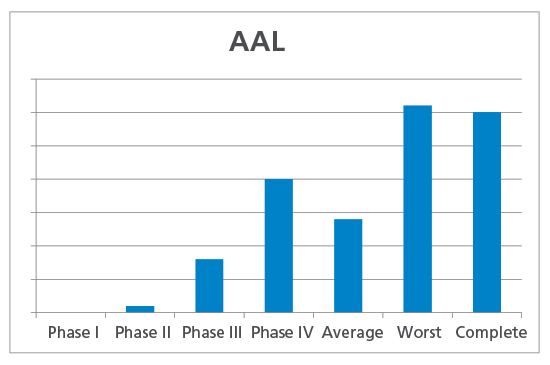
As expected, phase I has no losses because it is completed before hurricane season begins (Figure 7). Although phase III is typically the most vulnerable to hurricane winds, in this scenario, phase IV losses exceed those from phase III. This is likely the result of low replacement value in the beginning of phase III; as seen in Figure 7, hurricane activity only overlaps with this early portion of the phase—not with the end of phase III. Meanwhile, the end of phase IV does fall during hurricane season, resulting in high losses for that phase.
Note that the phase IV loss is actually far exceeded by the worst-case loss; in this instance, this is because the phase losses are calculated over the duration of the individual phases, and include periods when hurricane frequency was zero.
Conclusion
Due to the dynamic nature of the risk to buildings under construction, AIR has developed a comprehensive approach that takes into consideration changing replacement values and vulnerability to understand potential damage and losses to these structures. CLASIC/2 Version 14.0 introduces the ability to model builder's risk policies for the AIR earthquake and hurricane models for the United States. By integrating vulnerability, cost, and seasonality functions for buildings of different construction and occupancy classes, the model accurately estimates hurricane and earthquake risk to buildings at each construction phase, from foundation and substructure to finish, and for the construction project as a whole.
1 U.S. Energy Information Administration: "2003 Commercial Buildings Energy Consumption (CBECS)."
2 Source: The United States Census Bureau.
3 Source: Value of Construction Put in Place—a survey conducted monthly since 1960 by the U.S. Census Bureau
