 Editor’s Note: AIR Director of Atmospheric Science Dr. Peter Dailey discusses forecasts for the 2011 Atlantic hurricane season and what they mean, and do not mean, in terms of insured losses.
By Dr. Peter S. Dailey
Edited by Nan Ma
The article: Discusses how seasonal forecasts are developed, the outlook for 2011, and the uncertainty in preseason predictions. Highlights: As uncertain as preseason storm count forecasts are, even more difficult is attempting to predict how many may make landfall and how much loss they may cause. The advantage of a catastrophe model is that it provides a fully probabilistic view of loss, without the need to forecast short-lived climate and weather signals that cannot be reliably anticipated in advance of the season. |
Introduction
We are three weeks into the 2011 Atlantic hurricane season, which began officially on June 1, and the Atlantic has been quiet thus far. But if preseason forecasts are realized, this dormancy will be short lived. Several public and government organizations (including Colorado State University, North Carolina State University, NOAA, and the UK Met Office) and commercial entities (including WSI and TSR) have predicted elevated levels of tropical cyclone activity in the Atlantic basin this year.
These forecasts, however, are subject to limitations in the ability to anticipate climate and weather signals weeks to months in advance, and are hence characterized by considerable uncertainty. This article will examine how forecasting agencies develop seasonal predictions and discuss the volatility in activity metrics, particularly in landfall counts, which is most relevant to P&C companies concerned with hurricane risk.
Multiple Factors Influence Tropical Cyclone Development
Over the course of a hurricane season, several factors come into play in determining tropical cyclone formation, track and intensity. To help clients better understand whether these environmental conditions are favorable or unfavorable for the development of tropical cyclones in real-time, AIR provides a service called ClimateCast®, which is updated several times a day and is available free of charge from the ALERT™ website.
As an example, Figure 1 shows ClimateCast from May 31, 2011, immediately prior to the official start of the season. The upper left panel contains an overview of the year's tropical cyclone activity in the North Atlantic to date, including the track and intensity of active storms, if any. The summary panel also compares activity metrics (including storm counts and ACE index values) from the season to date with climatology (the statistics of an “average” season).
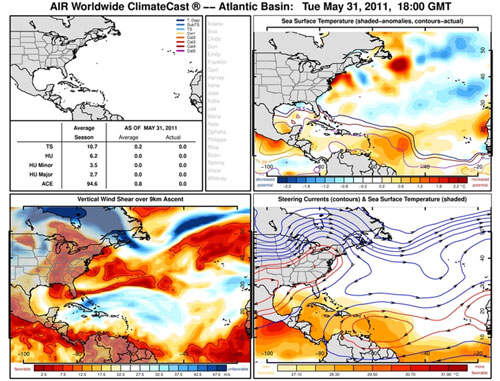
Figure 1. AIR’s ClimateCast product from May 31, 2011 at 1800 Greenwich Time
The upper right panel shows current sea-surface temperature (SST) contours and the shading represents SST deviations (anomalies) from the climatological average. The anomaly field gives an indication of which areas over the ocean can support strong, deep convection and thus tropical cyclone development. The warmer colors—the oranges and reds—indicate high risk zones, places where the ocean is not only warm enough for hurricane development (south of the thick black 26.0°C contour), but is also warmer than average for the current time of year.
The panel on the bottom left shows current vertical wind shear conditions. High vertical wind shear can disrupt the overall structure of the hurricane, impeding cyclone formation or weakening an existing storm. Regions of low shear (shaded in oranges and reds) indicate where tropical storms could potentially exist or intensify, while regions of high shear (shaded in blues) indicate where environmental conditions are unfavorable to cyclone development.
The final panel on the bottom right shows contoured steering current overlaid on current SSTs. Steering currents indicate the mean flow in the middle troposphere, and indicates the direction in which an existing storm is likely to be guided.
The data in the ClimateCast environmental condition maps is provided by the National Oceanographic and Atmospheric Administration (NOAA), whose National Hurricane Center (NHC) is responsible for producing and disseminating weather and emergency management information, including coastal warnings, wind speed probabilities, and track forecasts. Even in real-time, under known environmental conditions, there is a great deal of uncertainty associated with the NHC’s tropical cyclone forecasts. For example, the NHC’s familiar “cone of uncertainty” reflects 67% confidence in the storm’s forecast track. With this degree of uncertainty even when storms are actively developing under known conditions in the Atlantic, it’s no surprise that seasonal forecasters have an enormous challenge in predicting activity months in advance.
How Do the Forecasters Do It?
As mentioned previously, preseason forecasts depend on the ability to predict key environmental conditions—sea surface temperature anomalies, wind shear levels, and steering currents—in advance of an upcoming season. SSTs are somewhat predictable in advance of the season, owing to the ocean’s enormous heat capacity or thermal inertia. If the ocean is warmer than average today, it will very likely remain warm tomorrow, and so forth, because it takes a great deal of energy transfer to change the ocean’s temperature. In fact, during the hurricane season, the Atlantic basin has been warmer than average each year since 1995. The SST anomalies forecast for July–September, shown in Figure 2, indicate slightly higher than average sea surface temperatures are expected in the Atlantic during the height of the hurricane season.
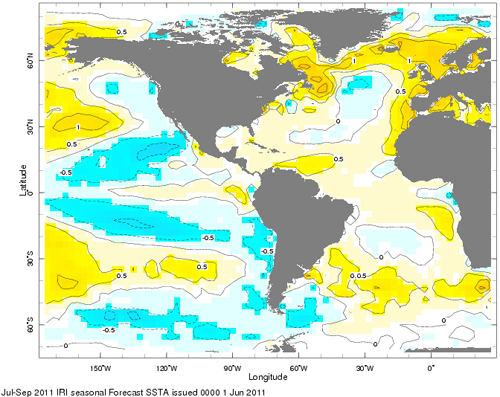
Figure 2. SST anomalies forecast for July, August, September (Source: IRI)
Interestingly, Atlantic wind shear variability is connected to sea surface temperatures in the Pacific, which in turn is correlated with the El-Niño Southern Oscillation (ENSO) and has a semi-regular oscillation of 3 to 7 years. During the warm phase of ENSO, known as El Niño, wind shear in the Atlantic is typically elevated. The cold phase of ENSO (La Niña) is associated with reduced Atlantic shear, which as mentioned earlier is favorable to cyclone activity.
Figure 3 shows a composite of ENSO forecasts for 2011 from various forecasting agencies around the world.
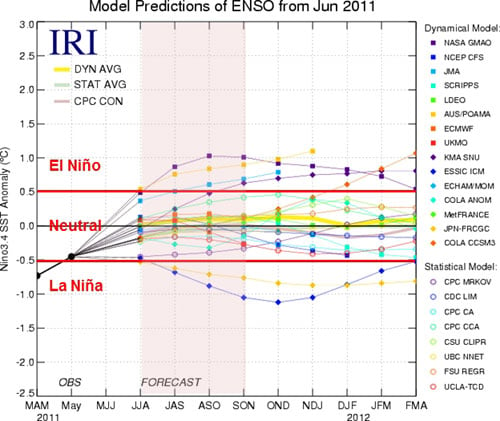
Figure 3. ENSO model predictions issued in June 2011 (Source: IRI)
La Niña conditions, which persisted through 2010 and into 2011, dissipated this May into the neutral phase of ENSO (defined as an anomaly of less than 0.5°C). Most models forecast that neutral conditions will continue through the end of the season, an indication that neutral wind shear conditions are expected in the Atlantic. However, as with any climate signal forecast, there is uncertainty in ENSO predictions, with some models predicting a trend towards El Niño conditions, and others showing a gradual return to La Niña.
Finally, steering currents are very difficult to predict in advance of the season. In contrast to ocean signals like ENSO, steering currents are an atmospheric phenomenon and have a much shorter “memory”, making them less predictable on long timescales. Research indicates, however, that steering currents are somewhat correlated to a signal known as the North Atlantic Oscillation (NAO), which can increase or decrease westerly winds over the Atlantic by affecting the position of the Azores High, a semi-permanent area of high pressure over the coast of West Africa. Unfortunately, like steering currents, the NAO is not very predictable beyond a week or two.
To summarize, Figure 4 shows the serial process by which most seasonal forecasts are constructed. Included are the environmental conditions discussed above, as well as other predictors used by some forecasters such as the Saharan Air Layer (or Saharan dust storm activity), which can adversely influence storms forming off the coast of Africa. Moving from left to right in this diagram—from first predicting the environmental factors that influence activity to predicting basinwide activity metrics, to finally predicting storm landfalls—the uncertainty increases and the predictive skill of the forecasts decreases.
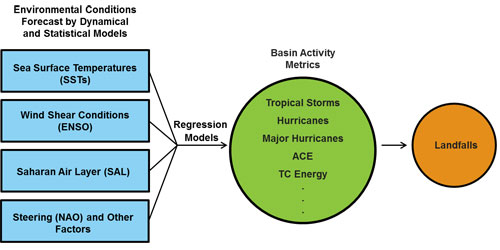
Figure 4. Process by which most seasonal forecasts are constructed
Forecasts for the 2011 Season
Figure 5 is a summary of the forecasts for 2011 that have been issued as of the writing of this article. The prediction from NOAA’s Climate Prediction Center (CPC) includes 12 to 18 named storms, with 6 to 10 of them reaching hurricane strength. The dotted line indicates the long-term climatological average. Note that most of the forecasts call for elevated activity relative to normal. This has been consistent starting from the earliest forecasts, issued back in December of last year.
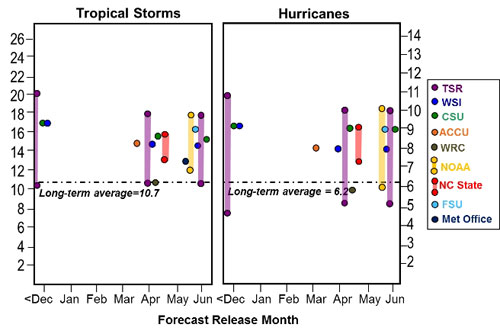
Figure 5. Preseason forecasts for the 2011 Atlantic hurricane season
Note that some forecasts, like the ones from NOAA and Tropical Storm Risk (TSR), are reported as a band, or range, while others are point forecasts of a particular count. This is analogous to predicting tomorrow’s high temperature in the mid-70s, versus predicting a high of exactly 75 degrees. The latter is no more precise, it simply does not reflect the level of uncertainty in the prediction.
Also worth noting is the absence of landfall predictions in most seasonal forecasts. As discussed before, landfalls (and thus regional risk and insured losses) are very sensitive to day-to-day weather conditions and cannot be predicted well in advance with any skill. Thus, the goal of seasonal forecasts is to provide a general indication of basinwide activity levels, not to predict precisely where hurricanes will form, how they will track, and if and where they will make landfall.
Even when environmental conditions are accurately forecast in advance, day-to-day weather variability makes it very difficult to correlate basinwide activity with landfall risk and losses. Thus when forecasters call for elevated landfall risk, this is typically an artifact of elevated basinwide activity in general. In other words, if one predicts twice the number of hurricanes compared to average, and that forecast is skillful, then there is implicitly an elevated risk that one or more hurricanes will affect land.
However, even highly active seasons can result in landfalls and losses that fall well short of expectation. Last year in 2010 for example, preseason forecasts for warm Atlantic SSTs and La Niña conditions—and elevated seasonal activity metrics (predicted number of storms and hurricanes)—all proved to be correct. However, steering currents kept hurricanes away from the U.S. coastline, and U.S. hurricane losses were not significant.
Understanding Volatility
The considerable uncertainty in seasonal forecasts stems from multiple sources, one of which is the fact that the environmental conditions used to forecast seasonal activity only explain a small portion of the year-to-year variability. One way to understand this uncertainty is to examine volatility levels in the historical data itself, as shown in Figure 6. It shows the historical count of tropical storms, hurricanes, and U.S. hurricane landfalls since 1948, along with the long-term mean for each.
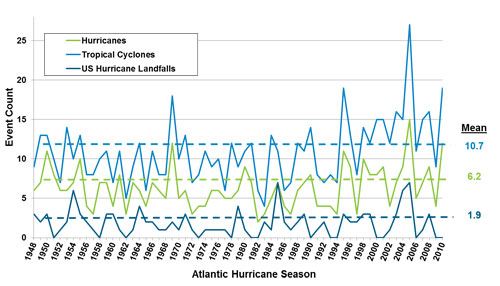
Figure 6. Counts of tropical storms, hurricanes, and hurricane landfalls since 1948
On an absolute scale, the count of seasonal tropical is the most volatile, swinging significantly above and below the mean. Relative to the value of the mean, however, the variability is highest for U.S. hurricane landfalls. To emphasize this point, Figure 7 shows the coefficient of variation (CV), which is the ratio of the standard deviation to the mean of the dataset and is a general indication of that dataset’s volatility.
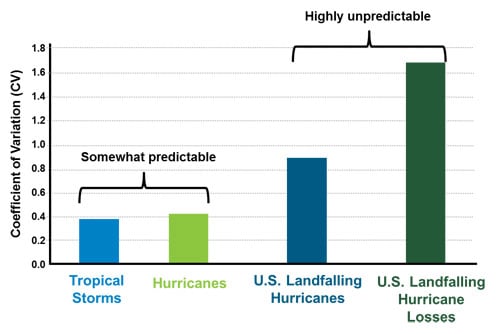
Figure 7. Coefficient of variation (CV) based on annual data from 1948–2008
The CV for tropical storm count, with an average of about 11 storms and a standard deviation of about 4 storms, is 0.40 or 40%. This means that a blind forecast of between 7 and 15 tropical storms (11 ± 4) will verify about 70% of the time. For hurricanes, the average rate of hurricane formation in the basin is about 6 storms per year, and the standard deviation is almost 3 storms, meaning that the CV for hurricane count is about 0.50. CVs of 0.40 and 0.50 indicate significant volatility, but these basin storm count metrics are still somewhat predictable in advance of the season.
For hurricane landfall rates, the annual variation is nearly as high as the mean itself, at about 2 landfalls per year. Even more dramatic, the standard deviation in insured seasonal losses is nearly twice as large as the average annual loss. This reinforces the fact that landfall and loss are highly variable and exceedingly difficult to predict before the season begins.
Conclusion
Seasonal forecasts are meant to provide an indication of activity in the upcoming season relative to the long-term average. As uncertain as preseason forecasts are, in and of themselves, predictions of where hypothetical storms will track, where they will make landfall, and how big the losses will be lack skill, making such seasonal forecast information impractical from a risk management point of view.
The advantage of a catastrophe model is that it provides a fully probabilistic view of loss, without the need to forecast short-lived climate and weather signals that cannot be anticipated in advance of the season. AIR provides two basinwide Atlantic stochastic catalogs, one based on all landfalling hurricanes since 1900 and one conditioned on seasons with anomalously warm sea surface temperatures in the Atlantic. Both contain thousands of realistic simulated years of activity designed to prepare companies for the full range of possible loss scenarios, from seasons with no landfalls to seasons with high activity levels like that observed in 2005.
