


Post-Disaster Survey Findings from the Christchurch Earthquake
Editor's Note: Dr. Tao Lai, Senior Principal Engineer at AIR, recounts the magnitude 7.0 earthquake that struck New Zealand’s South Island on September 4, 2010.
Introduction
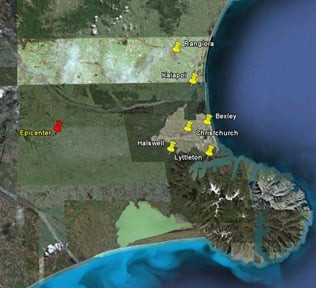
Just after 4:30 AM local time (16:35 UTC) on September 4, 2010, thousands of New Zealanders were jostled awake by an earthquake registering 7.0 on the moment magnitude scale. The quake, which struck 45 kilometers west of downtown Christchurch, in the Canterbury Plains of New Zealand’s South Island, was a strong magnitude event with a shallow focal depth (5 kilometers). Within roughly 24 hours of the event, AIR issued insured loss estimates to residential and commercial buildings between NZD 2,700 million (2.0 billion USD) and NZD 6,000 million (4.5 billion USD). A week later, AIR was collaborating with researchers on the ground in Christchurch to perform a damage survey.
Those buildings most severely impacted were unreinforced masonry (URM) structures, particularly older URM structures, of which there are a number in Christchurch, the South Island’s oldest city. Nonstructural damage—such as to parapets and chimneys—was more common; according to early estimates, over 15,000 chimneys sustained damage considered severe1.
Immediately following the earthquake, officials in Christchurch activated the building safety evaluation process developed by the New Zealand Society for Earthquake Engineering. Officials cordoned off streets in order to individually assess buildings.
By mid-September, the government had passed the Canterbury Earthquake Response and Recovery Act. Its goal is to ensure the government has adequate power to facilitate a prompt response, giving parliament the power to proceed with the task of rebuilding damaged homes, business premises and infrastructure. Not surprisingly, the legislation has resulted in some controversy, such as whether the government may be too quick to demolish historic heritage buildings and whether homeowners will be prevented from rebuilding in areas where damage from liquefaction was severe.
 By: Dr. Tao Lai
Senior Principal Engineer, Research

Many Events, Little Damage: New Zealand’s Tectonic Setting
Beneath New Zealand, the Australia and Pacific plates collide, resulting in high seismicity; more than 14,000 earthquakes occur along this section of plate boundary each year. Most are unfelt. Only around 20 of these have a magnitude in excess of 5.0, on average, and roughly 10 cause discernable damage.
The Christchurch earthquake was the most damaging seismic event in New Zealand since the Hawke's Bay quake in 1931. It produced a 22 kilometer-long surface rupture in the Canterbury Plains near the town of Darfield, 35 kilometers west of Christchurch. The area is predominantly farmland. According to officials at New Zealand’s Institute of Geological and Nuclear Sciences (GNS), prior to the event on September 4, nothing in the plains landscape would have suggested a fault lay below.
After the quake struck, scientists hypothesized that the Greendale fault was the culprit, although the fault had not been considered active because there were no observable earthquake-related geomorphic features on the surface to identify it. Indeed scientists believe that the most recent rupture of this fault occurred before the last glaciations—about 18,000 years ago.
Further findings in the weeks following the earthquake suggested that the Greendale fault was not the only actor. GNS scientists identified a previously unknown, blind thrust fault nearby and to the north, which also ruptured on September 4. They believe that when it ruptured it activated the Greendale fault. Scientists are still trying to determine the exact location and extent of the newly discovered fault.
Model Performance in Real Time
On September 4, 2010, the day after the Christchurch earthquake, AIR earthquake researchers were running simulations of the event using the available information on epicentral location, depth, magnitude and direction of rupture. Within roughly 24 hours, AIR issued estimates of industry losses and was assisting clients assess losses to their own portfolios.
Model results generated in real time indicated that insured losses to residential and commercial buildings would be between NZD 2,700 million (2.0 billion USD) and NZD 6,000 million (4.5 billion USD), with insured losses to EQC—which covers only residential claims—ranging between 1.0 billion USD and 1.8 billion USD. Based on initial estimates from the insurance industry, AIR’s model results in real time are in good agreement.
Two and half months later, the EQC has settled about 20% of the more than 138,000 claims it has received. The claims development pattern at the EQC is consistent with what has been observed in other large earthquakes elsewhere in the world. It will likely be many months before the industry has a final tally of the total insured loss from this event.
In the absence of any substantive information about what was happening on the ground, AIR’s loss estimates issued immediately following the earthquake provided much needed information about loss potential. On September 12, just a week after the quake, AIR collaborated in Christchurch with the Earthquake Engineering Research Institute , the Geotechnical Extreme Events Reconnaissance Association, and faculty and staff from the University of Canterbury to survey the damage. Most of the observations were consistent with expectations, with the exception of the degree of liquefaction-induced damage.
Providing loss estimates for earthquake events in real time is challenging because of the considerable uncertainty surrounding the actual parameters of an earthquake in its immediate aftermath; the good agreement between AIR’s real-time modeled losses and the losses the industry reports today serves to validate the methodology behind AIR’s model.
New Zealand’s Building Stock
In 1931, the M 7.8 Hawke's Bay earthquake—the largest to strike the country in recorded history—devastated New Zealand’s North Island. It marked a turning point for earthquake engineering in the country, triggering the development of national earthquake design standards. Today, the country’s building codes are among the most stringent in the world.
The Hawke’s Bay earthquake highlighted the vulnerability of New Zealand’s URM building stock. In 1968, the New Zealand National Society for Earthquake Engineering together with other organizations introduced legislation to strengthen these high-risk structures. Most major cities and towns abided. In Wellington, for example, seven hundred buildings were identified as earthquake-prone between 1968 and 2003. Of these, 500 were strengthened or demolished2.
Most recently, efforts to strengthen deficiencies in the most vulnerable of the still-existing URM buildings have culminated with the Building Act of 2004, which requires local authorities in each of New Zealand’s 73 territories to identify “earthquake-prone edifices”3; buildings identified as such may be required to be brought up to at least one-third of the earthquake resistance standards for new buildings.
Beyond the one-third minimum, a specific strengthening level is not specified. As a result, territories have adopted varying levels of strengthening, some higher and some meeting only the minimum required. This may in part explain the damage seen among older URM buildings following September’s Christchurch earthquake. While the predominant construction types in New Zealand today include wood frame and reinforced concrete frame, URM continues to dominate the older building stock. According to one report, there are almost 1,000 URM structures in the Canterbury region alone4.
Damage Survey Overview
On September 12, scarcely a week after the event, AIR joined forces with members of the Earthquake Engineering Research Institute (EERI), the Geotechnical Extreme Events Reconnaissance (GEER) Association, and faculty and staff from the University of Canterbury to conduct a damage survey. In the sections below, the areas surveyed are presented in order of decreasing proximity to the epicenter.
Throughout the survey, it became clear that liquefaction was a primary driver of damage. When an earthquake strikes an area that is saturated with groundwater, the shaking can cause the soil to lose its stiffness due to increased water pressure, and behave like a heavy liquid. When this happens, the soil loses its capability to support structures. Buildings can suddenly tilt or even topple over as the ground beneath them subsides, or settles. In some areas, the ground may move laterally, a phenomenon known as lateral spreading. This too, can cause buildings to lean.
Settlement and lateral spreading impacted a large number of homes in Christchurch and in communities 50 km from the epicentral region. Many of these coastal regions were built on filled swamp and wetlands, which are particularly prone to liquefaction.
While liquefaction had been identified as a potential hazard prior to this earthquake, the Christchurch earthquake revealed that the area of vulnerability was larger than previously thought.
Halswell (40 kilometers southeast of the epicenter)
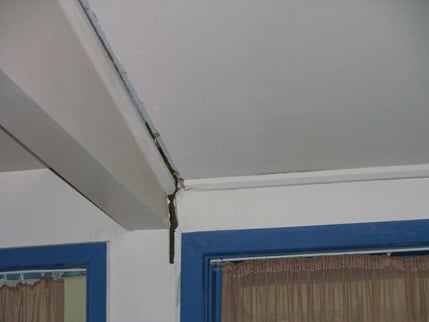
At the primary school in Halswell, some 40 km southeast of the epicenter, the effects of liquefaction were visible both inside and out. Some contents damage was seen but damage from ground shaking was limited. Engineers observed considerable separation at construction joints apparently due to uneven liquefaction settlement.
The City of Christchurch (45 kilometers east of the epicenter)
The most significant physical impact in Christchurch was damage to infrastructure, though power and water in the city were quickly restored.
Buildings fared well overall. Most engineered structures appeared to be completely intact at the time of the survey. However, severe damage occurred in a number of URM buildings in the Central Business District. Un-braced parapets toppled and, in some cases, inadequate connections between walls and roofs caused the collapse of the gable ends of upper walls. On one 80-year old apartment building of eight stories, shear cracks were visible between windows. The same building also suffered column damage on its interior.
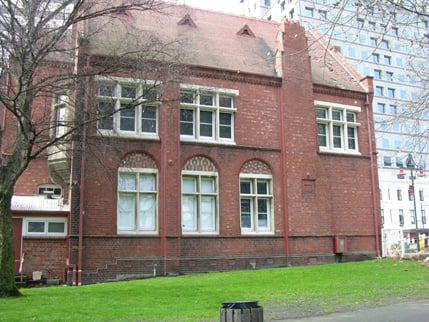
Notably, many of the URM buildings that had been retrofitted performed very well. The survival of one built in 1858 was attributed to a retrofit that included vertical steel bracing along the joint of the chimney wall and along columns; the building only sustained light damage to contents and parapets. Another survived because of horizontal steel bracing, which made the building equivalent to a confined masonry structure.
The City Council building, an 8-story reinforced concrete structure, had gone through an extensive NZ$113 million renovation and had re-opened just one month before the earthquake. It showed no exterior damage. However, it sustained nonstructural damage to its interior, including cracks in the stairway, plasterboard, and timber flooring. The cost of repairs following the damage has been estimated at between NZ$ 2.5 and 5 million.
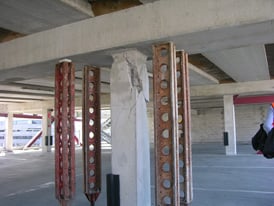
According to a local engineer, the most severely damaged engineered building in Christchurch may have been a parking structure at the Christchurch Women’s Hospital (Figure 6). The 3-story precast reinforced concrete parking structure with asymmetric steel bracing experienced severe structural damage to columns on its top floor due to torsional movement.
Despite the large magnitude of the quake, the structural damage that did occur in Christchurch was relatively minimal. Several factors contributed to this. First was the distance of the city from the epicenter; second, the rupture moved east to west, away from the city; finally, New Zealand’s stringent building code and good construction quality clearly proved their worth, leaving, in general, only older URM buildings to be singled out.
Bexley (50 kilometers east of the epicenter)
Bexley, a suburb in east Christchurch, has the dubious distinction of being home to Christchurch’s worst hit street. The wetland soil there—backfilled in the 1980s—is particularly prone to liquefaction.
Following the quake, more than 80% of the 200 single family homes on the backfilled plot had reportedly experienced some level of liquefaction damage. More than 100 of these were deemed uninhabitable. Almost all homeowners interviewed said their houses showed signs of uneven settlement. Because the earthquake acceleration recorded in downtown Christchurch (about 0.2g) was deemed insignificant from a hazard standpoint, the severe liquefaction in Bexley serves as a reminder that even low seismicity regions with landfill or soft soils can experience damaging liquefaction.
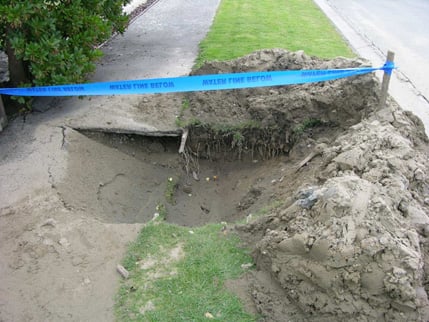
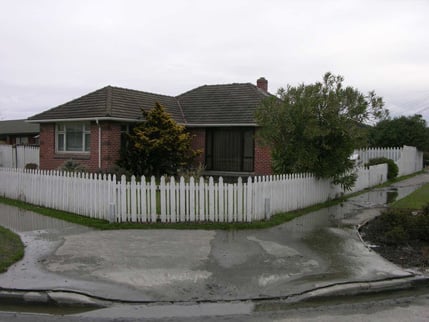
The sand that surfaced on the ground due to liquefaction entered into drainage systems here, resulting in damaged plumbing and flooding in homes (Figure 7 & Figure 8.). The New Zealand Earthquake Commission (EQC), which is the state insurance provider, covers this type of flood damage. Repair of the town’s drainage systems was a major focus of earthquake recovery efforts.
While some buildings impacted by large lateral spreading or heavy settlement were considered safe from a structural perspective, in the long-term these buildings could potentially be declared uninhabitable due to their location on unstable foundations.
Port of Lyttleton (55 kilometers southeast of the epicenter)
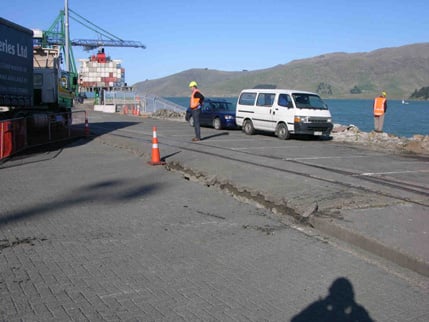
The Port of Lyttleton—the South Island’s largest port—was built in 1970. Some liquefaction damage from lateral spreading was visible here (Figure 9), although it did not disrupt operations. The port authority has asked the government of New Zealand for NZ$ 25 million for repairs. During the survey, no damage to cranes, containers or hulls was visible
Kaiapoi (55 kilometers northeast of the epicenter)
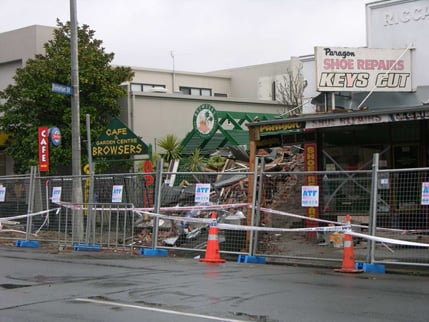
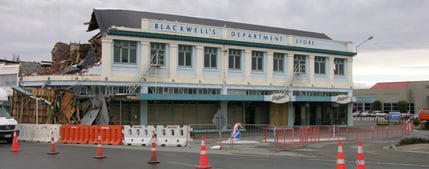
The survey included a visit to the commercial street of Kaiapoi, a town north of Christchurch near the mouth of the Waimakariri River. The second floor of Blackwell’s, a department store with a 135-year history, partially collapsed (Figure 10). The store will be demolished and rebuilt. Most other damage on the commercial street was to nonstructural elements or to infrastructure. Still, access to many areas was restricted due to safety concerns, which led to significant business interruption. At the time of survey, 40% of businesses were still closed.
Along Courtenay Drive in Kaiapoi—a small residential neighborhood bordered on two sides by wetlands—severe liquefaction occurred where direct shake damage was not obvious. In some places, fissures were as wide as 1.2 meters. The building damage that resulted varied from one house to the next, even within close proximity. On one row of 24 buildings, six were being considered for demolition, while another six appeared completely intact. The rest had sustained only minor damage. No shake damage was evident.
Insurance Impacts
In 1945, the government of New Zealand established the EQC to protect its citizens from the financial impacts of earthquakes. The current EQC policy provides coverage of up to NZ$ 100,000 per residential structure and NZ$ 20,000 for residential contents. EQC-backed earthquake insurance is held by approximately 85% of homeowners.
In the days following the quake, the New Zealand treasury reported that total residential and commercial costs to the EQC could reach NZ$ 2 billion. The EQC initially estimated it would receive 100,000 claims, but as of November 17, it had received close to 120, 000. The country’s Insurance Council is now calling the quake the largest single insurance event in New Zealand’s history.
Demolition of Historical Buildings
A number of URM buildings in Christchurch are heritage sites which constitute a quickly diminishing feature of the nation’s legacy. A study published in 2009 emphasized the hesitance of architects to retrofit these buildings, let alone demolish them.5 Within 14 days of the quake, however, many of these smaller URM buildings were torn down by property owners.
Not surprisingly, preservationists in the city have been vocal in their displeasure, prompting the government to pass legislation requiring demolition to cease pending review of building damage case by case. Owners of hundreds of heritage sites will now need to negotiate the fates of their properties. Questions remain about which of these buildings the city will want to preserve and how it will financially assist building owners in the process.
Rebuilding on Shaky Ground
Another issue currently facing the city of Christchurch is whether to permit homeowners to rebuild on ground now identified as highly susceptible to liquefaction. In the aftermath of the quake, the EQC permitted homeowners to make temporary repairs but not to rebuild, stating that scientists needed time to determine whether rebuilding was advisable.
In mid-October, the EQC released a detailed geotechnical report which provided information about the rebuilding process. Most homeowners were told that their land could be remediated, or made less susceptible to liquefaction. However, that could take up to two years. This has led to frustration among homeowners, many of whom would rather receive payout on their land and leave than wait as long as two years for remediation.
New Zealand’s government began the first round of home repairs in mid-November. Builders will work on more than 50,000 homes, beginning with residences in Halswell.
Nonpeak Losses Impacting Reinsurers
Claims from this event that exceed the amount paid by the EQC will likely be covered by reinsurers.6 This year, “non-peak” loss events such as the Christchurch earthquake are taking a heavy toll on the reinsurance community. While peak losses result from catastrophes in areas of high hazard and high exposure, and include losses from US hurricane, US earthquake, European winter storm and Japan earthquake, non-peak losses result from catastrophes in areas where hazard is lower and exposure is less concentrated. Such areas may not even be on the minds of most reinsurers until they are impacted by a catastrophic event they had not anticipated.
Examples of non-peak loss events this year include the Chile earthquake in April (USD 8 billion according to Munich Re) and tornados across the United States (USD 9 billion year-to-date, according to PCS). These events serve as a reminder that the highest catastrophe losses don’t always come from peak regions or perils. For reinsurers with global exposures, these events also illustrate the value of utilizing a comprehensive suite of catastrophe models in order to gain a more complete picture of risk as it exists from both peak and non-peak sources of potential loss.
Closing Thoughts
While the majority of engineered buildings performed well in the Christchurch earthquake, there is no doubt that the strength of existing vulnerable structures, particularly URM buildings, needs to be reevaluated. Conclusions about the fates of these buildings will likely result in policies that—perhaps more rigidly than the Building Act of 2004—designate required levels of strengthening. Ultimately, however, the Christchurch earthquake once again proved the efficacy of strong building codes.
1 Estimate from the Earthquake Commission (EQC). The EQC is discussed in more detail later in this article.
2 Hopkins, 2009
3 Earthquake-prone buildings are those that would have their ultimate capacity exceeded in a moderate earthquake and would be likely to collapse (Hopkins, op cit.).
4 Ingham, 2010
5 Goodwin, et. al
6 More precisely, reinsurers pay EQC to cover the excess costs.
Elder, D., IF. McCahon, and M. Yetton, MD, 1991. “The earthquake hazard in Christchurch: a detailed evaluation.” Research report to Earthquake and War Damages Commission.
Goodwin, C., G. Tonks, and J. Ingham, 2009. "Identifying Heritage Value in URM Buildings." Journal of the Structural Engineering Society New Zealand: 22(2), 16-28.
Hopkins, D. , 2009. “Earthquakes and existing buildings: New Zealand experience 1968 to 2008.” Proceedings of the 2009 ATC & SEI Conference on Improving the Seismic Performance of Existing Buildings and Other Structures.
Ingham, J. and M. Griffith, 2010. "Performance of Unreinforced Masonry Buildings during the 2010 Darfield (Christchurch, NZ) Earthquake.” Research report for the New Zealand Society for Earthquake Engineering Clearinghouse: http://db.nzsee.org.nz:8080/web/lfe-darfield-2010/
