As a potentially catastrophic weather event approaches, you want to be sure you have enough data to be prepared. Fortunately, understanding your risk throughout the life cycle of a storm while it is happening is now possible. The Verisk Real-Time Analytics Bundle pulls together a suite of real-time data and analytics products from across Verisk that you may not be familiar with to help you understand your risk as events unfold. With three sophisticated data streams—Respond®, 3D Visual Intelligence, and ALERT™—you get a comprehensive suite of data, imagery, and analytics in one package.
- Verisk Weather Solutions’ Respond product provides automated near real-time weather data
- Verisk 3D Visual Intelligence generates pre- and post-event imagery for significant events for members of the Geospatial Insurance Consortium
- ALERT provides up-to-date information and loss estimates for major catastrophes worldwide
Bundled together these products enable you to get near real-time weather data for wildfire, hurricane, straight-line wind, tornado, and hail events in the United States. The information you can obtain for each of these perils varies because of the differing sources of information available to the data streams.
Respond, for instance, draws its information from multiple sources, including weather models and weather radar, and transforms these inputs through unique proprietary algorithms and data pipelines. We autofeed this synthesized data to you in near real time. Respond is platform-agnostic and can stream data in vector (shapefile) or raster format to be delivered via SFTP, API, ESRI REST, or Verisk mapping platforms. It is equally at home, in other words, in Touchstone®, Sequel Impact, Respond MAP, Catalog Viewer, or any other geospatial/mapping platform you may use.
Taking a hail event as an example, Respond will be providing your claims team with data within 15 minutes of the first hailstones falling and refreshes that data every five minutes. This is post-event data, but only just! And as this additional data comes in you will form a clearer picture of what is happening.
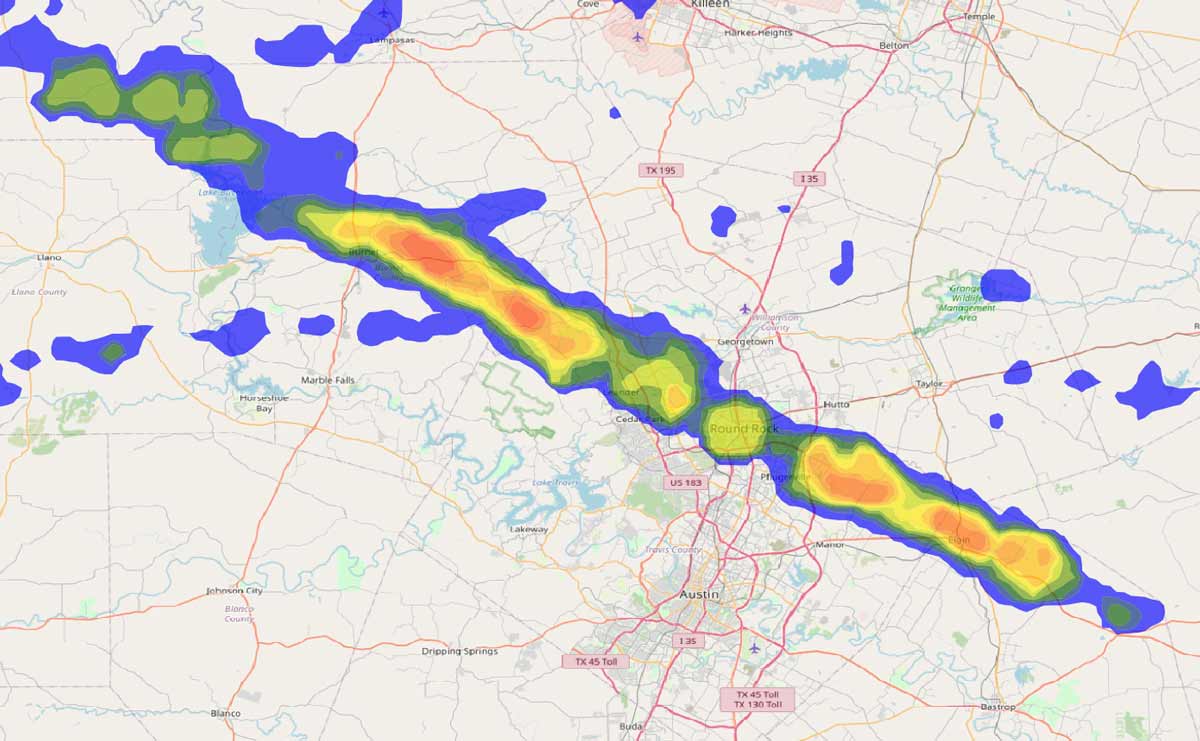
As the hailstorm continues—and while hail is probably still falling in some areas—you will have an initial event footprint to overlay your book of business and can start to triage your response. You will be able to begin estimating how much exposure you have in at-risk locations and how many claims may be submitted. You can see where the most severe damage is likely to occur and therefore where to focus your in-house loss adjusters and where third-party adjusters might be needed. You can also see where loss adjusters will most likely not be necessary so that your resources can be deployed most efficiently. And crucially, you can reach out to significantly impacted policyholders to inquire about their safety and whether they need any assistance.
By 8 a.m. on the morning after the hail event, additional data will have been reviewed by our meteorologists and the event footprint will have been refined. Insurers are able to confirm their understanding of locations and accounts likely impacted and form order of magnitude estimates of company exposure or potential loss. Reinsurers know which treaties may have been impacted by the event and can start estimating industry or company loss via market share.
To give subscribers a taste of what Respond can do, ALERT will provide Respond shapefiles for major events in 2022 (clients who license Respond as part of the Bundle will receive higher-resolution footprints for hail and wind). The Verisk Real-Time Analytics Bundle can provide you with the data and analytics you need, leading up to, during, and after an event. It enables you to zero in on the location and severity of an event as it is occurring and aids in triaging and settling claims more efficiently, resource deployment, reserve setting, and more.
Download the Verisk Real-Time Analytics Bundle U.S. Severe Thunderstorm Case Study