


Catastrophic flooding in the U.S., most recently Hurricane Ida–related, has dominated the news lately. Parts of Middle Tennessee—a region comprising 38 counties east of the Tennessee River and west of the Eastern Time Zone boundary—lay in Ida’s forecast path and were placed on a flood watch while still recovering from flooding after record-breaking rainfall that had fallen only the week before. On August 21, 2021, Middle Tennessee experienced record-breaking rainfall owing to a combination of intense thunderstorms initiated along a decaying frontal boundary, record high humidity levels throughout the atmosphere, and a weak spark in the upper-level flow.
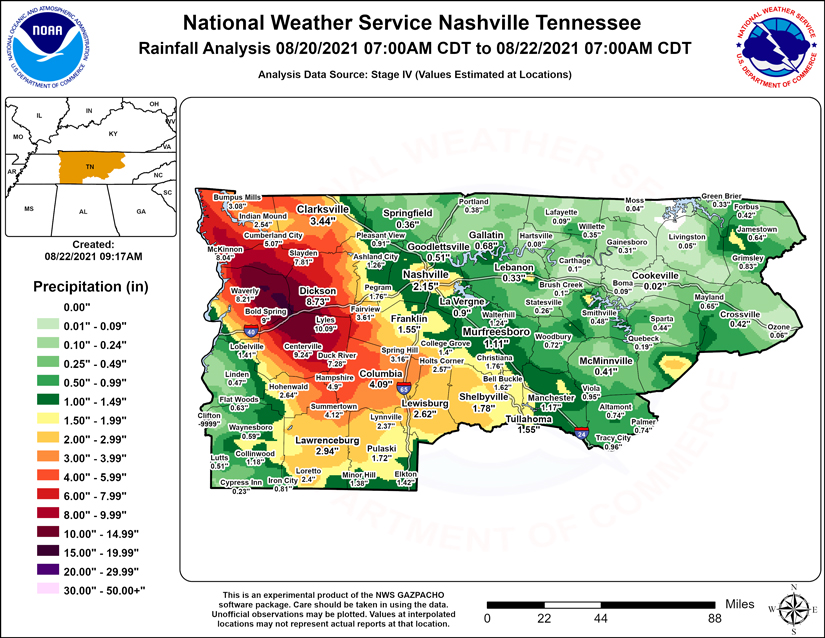
According to the National Weather Service Forecast Office, Nashville, TN, (NWS), Humphreys, Dickson, Houston, and Hickman counties experienced more than 15 inches of precipitation in 24 hours and some locations received as much as 17 inches (Figure 1). The river gauge at the Piney River level rose from 3.3 feet to 31.8 feet in less than 10 hours on August 21, recording the river well above its Major Flood Stage of 24 feet. The sustained intense precipitation and river overflow prompted NWS to issue flash flood warnings for five affected counties.
Most of the flood damage was seen in the City of Waverly and neighboring parts of Humphreys County. There were widespread reports of power outages and interruptions of telecommunications, water, and other utility services. According to the Tennessee Department of Transportation (TEMA), approximately 700 homes were flooded during the event and several roads and bridges were washed away. Many houses were dislodged from their foundations and a great number of vehicles saw severe flood damage mostly due to the floodwaters and debris carried by them.
Role of FEMA and NFIP
Soon after the flooding FEMA declared a disaster in the four most affected counties (Humphreys, Dickson, Houston, and Hickman), enabling individuals to apply for disaster assistance for debris removal and repairs; however, the disaster assistance covers only a portion of the repair and rebuilding costs. If those homes were insured through the NFIP program, they would have been covered for up to USD 250,000 for building damage and USD 100,000 for contents. The reluctance of communities in these counties to enroll in FEMA’s National Flood Insurance Program (NFIP) and its implications given the severity of flood damage observed have been highlighted in media reports. This raises the question: “Did these counties have low NFIP penetration and is their level of penetration normal?” To answer this, lets take a look at how NFIP penetration has evolved over the past decade for these counties and if that looks different from the rest of Tennessee and the U.S.
The NFIP policies published by FEMA through the OpenFEMA resource contain NFIP insured limits and risk counts by county, state, and other disaggregations. If we look at growth in the Insured Limits by NFIP as a percentage over the years for the U.S. and Tennessee (Figure 2), the NFIP Limits for the U.S. have been stable over the years with some increase observed after the floods due to Hurricane Harvey in 2017 and Hurricane Florence in 2018. But in Tennessee there was a big increase in NFIP written policies and hence insured limits in 2010 and 2011—possibly due to people recognizing flood risk after the devastating floods of 2010 in Nashville. This increase in NFIP policies was due to the large increase in policies written in Nashville and the surrounding areas in Davidson County.
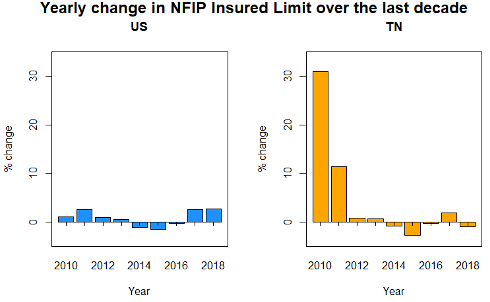
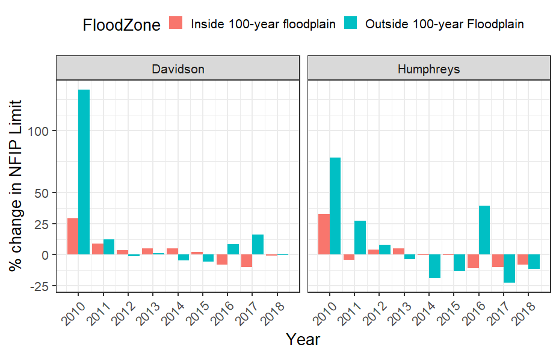
Figure 3 shows the percentage change in NFIP limits of Davidson County (impacted by the 2010 floods) and Humphreys County, one of the worst hit counties from the August 2021 floods. The plot also shows, through splits by FEMA flood zones, that most of the NFIP growth in Tennessee after the 2010 floods was outside the 100-year floodplain (FEMA X zones) in both counties. Since 2014 (as memories of the 2010 flood faded), however, the NFIP limit outside the 100-year floodplain in Humphreys County has been steadily decreasing, which probably highlights the lack of NFIP insurance in this county recently.
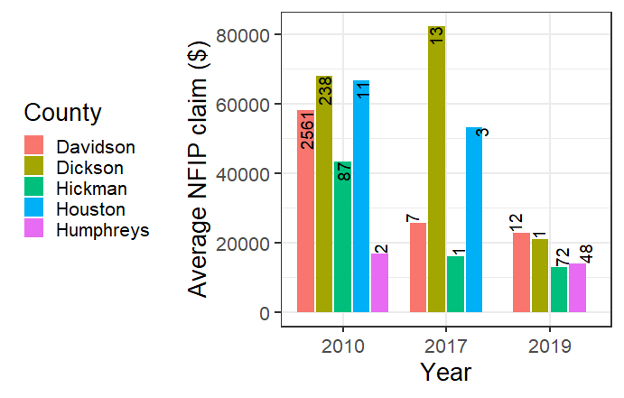
A second question arising from our look at this area is: “Is the NFIP enrollment related to lower risk in these counties when compared to the adjoining Davidson County?” Indeed, the number of buildings at risk due to flooding—and hence replacement value—might be higher in Nashville and the surrounding areas in Davidson County. However, more than 90% of the replacement value (computed using the AIR U.S. Industry Exposure Database) in all these counties lies outside AIR-modeled 100-year flood zones. In addition, if we look at average NFIP claim numbers in recent years (Figure 4), the four counties impacted by the 2021 flooding do not show a distinct or lower average number of claims when compared to Davidson County. The number of claims is indeed higher in Davidson County, but this is due to more risks being written by NFIP in this county.
This brings us to a final question: “Why were so many homes not insured through NFIP in these counties?” The answer is two-fold: first, NFIP enrollment of communities is voluntary and participation outside the 100-year floodplains is indeed lower; second, the risk in these communities is understated in FEMA’s outdated floodmaps. The FEMA floodmaps that delineate the 100-year floodplain are often based only on large rivers and streams and do not capture localized flash flooding potential—a potential that this event illustrated clearly. The AIR Inland Flood Model for the United States accounts for both riverine and off-plain flooding and the 100-year flood maps released by AIR give a truer representation of flood risk in such locations throughout the country.
Enrollment in NFIP programs requires some basic mitigation practices to be implemented by homeowners, such as elevating their home’s lowest floor to be above the 100-year flood level, elevating service equipment to prevent flood damage, and ensuring that here are no obstructions in any crawlspace or other enclosures to enable flow of floodwaters without causing damage. Over the years since its introduction this Flood Insurance Risk Map (FIRM) compliance requirement has been shown to be beneficial through the adoption of these mitigation practices. The average claim of a post-FIRM compliant building is much lower than a pre-FIRM non-compliant building. As flood risk grows outside the FEMA 100-year floodplains, these basic mitigation measures are becoming more important in reducing losses from such catastrophic events in the future.
AIR’s U.S. hurricane and flood models account for changes in NFIP regulations and FIRM compliance. In addition, AIR leveraged detailed high-resolution NFIP data as part of the model validation process for these models when they were updated in 2020. Users can also get customized flood risk views by inputting their choice of flood zone and/or FIRM compliance and other such mitigation measures into these models. AIR’s hurricane and inland flood models for the United States realistically and comprehensively capture the risk for flood on and off the floodplain at high resolution, allowing insurers to expand into new markets profitably.
Quantify flood risk and uncover new opportunities with AIR inland flood models.
